

by Craig Hemke, Sprott Money:

The price of gold is up over $100 year-to-date and yet precious metal enthusiasts are suffering through some of the worst sentiment and depression on record. Why? It’s hard to say, but the performance of the mining shares thus far in 2023 has a lot to do with it.
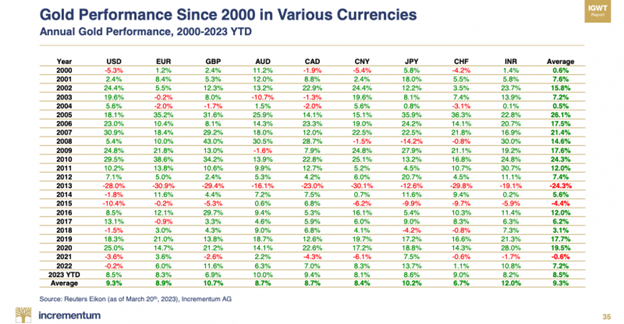
Let’s start with the gold price. As I type this on June 20, COMEX gold is up $118 on the year or about 6.5%. This is right in line and moving toward the annual average gain since the new century began, as you can see below in this chart from Ronnie Stoeferle and his team at Incrementum.
TRUTH LIVES on at https://sgtreport.tv/
So, with gold prices higher and physical gold performing the function so many of us had in mind when we bought it, why is sentiment so poor? I believe much of the issue is related to the underperforming mining shares, which many people own as “leverage” to the gold price and as a way to make some extra fiat via potential gains.
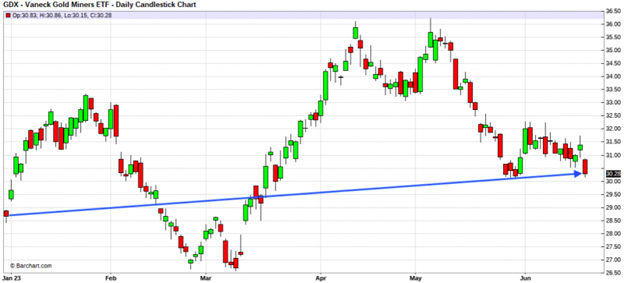
But, as you can see below, the GDX ETF (which can be used as a proxy for the mining shares) is up just 5.6% year-to date. That’s not as much of a gain as the S&P 500, but what else is new? The sector remains out of favor with general investors and has been for quite a while. As such, the mining shares are not providing the sort of “price leverage” that many of us had hoped for.
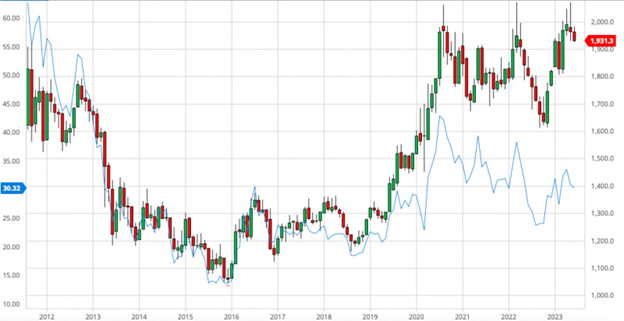
Digging deeper, why are the gold mining shares not keeping pace with the gold price? Well, there are all sorts of reasons for this: high energy costs, compressed margins, poor management, you name it. But the biggest frustration can be traced to the chart below. As you can see, when the gold price topped at $1920 in September of 2011, the price of the GDX was above $60/share. Today the share price of the GDX is about half that, with a major decoupling over just the past four years. (COMEX gold in candlesticks, the GDX as a blue line.)
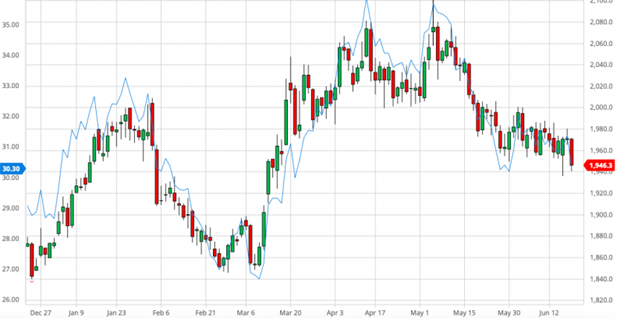
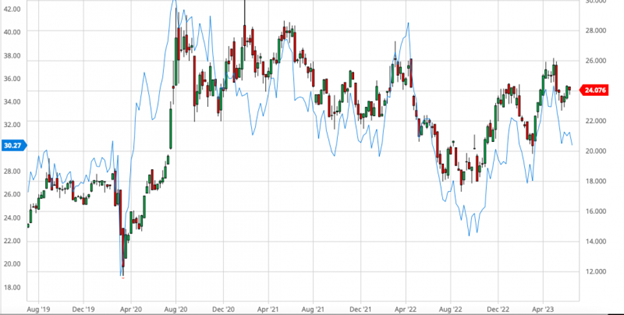
So what has caused this current “decoupling”? Hmmm…that’s a good question. Perhaps the price of COMEX gold and the GDX were never correlated in the first place? What if, instead, the price of COMEX silver is what drives the GDX? That would be weird, wouldn’t it? But let’s see. Here’s the correlation year-to date. GDX is still displayed as a blue line, but this time it’s COMEX silver that’s in candlesticks.
But that’s just the past six months. What about the past four years—that time since what appeared to be that “decouple” with the COMEX gold price?
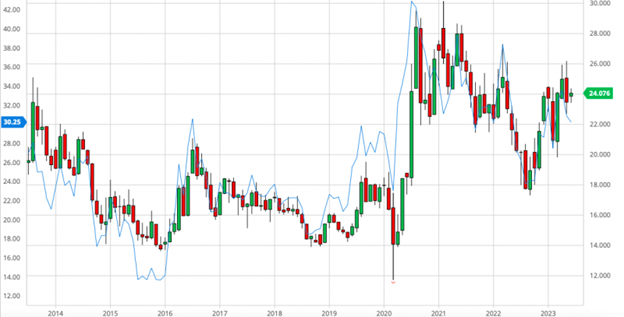
I don’t know. Maybe you think I’m cherry-picking dates? If so, let’s go back ten years.
Still with me? Good. Then let’s go back as far as we can, to the inception of the GDX on May 16, 2006.
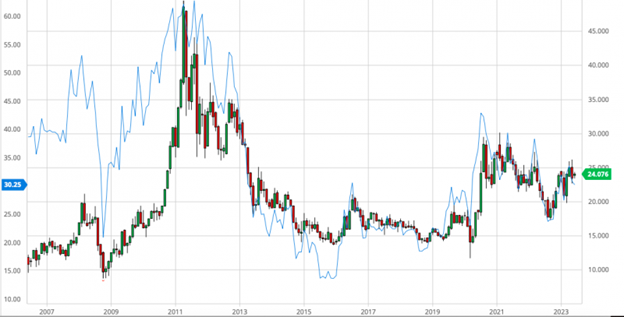
And now I can hear you murmuring the old saying people use when they want to sound smart: “Correlation is not causation.” Yeah, well, maybe so. But not in this case. To my eye, that’s about a pretty tight correlation since 2011, and as you’re likely aware, over 80% of all equity trades on a daily basis can be attributed to high frequency trading and computer algorithms. See this study from late 2022:
High Frequency Traders and Liquidity
From here, I will allow you to draw your own conclusions. Perhaps that whole correlation/causation thing is the reality? Maybe this is nothing and there is no basis for the GDX price to track the price of COMEX silver? After all, the fund primarily holds gold producers and royalty companies. You have to get all the way down to holding #14 before you find Pan American Silver at 2.37% weighting. Why would there be a link to silver? That makes no sense.