

by Jesse Colombo, BullionStar:
After more than three years of stagnation, gold has awakened with a vengeance since early-March and has promptly surged by nearly $300 an ounce or 14% to an all-time high $2,330 — a sharp move for a safe-haven asset that has a reputation for its slow and steady trends. Gold’s powerful rally came seemingly out of the blue and has confounded the majority of investors and commentators who have been much more focused on trendy speculative stocks and cryptocurrencies as of late. In this piece, I will explain several of the technical and fundamental factors that are driving gold to all-time highs, what is likely ahead for gold, and how investors can best take advantage of the yellow metal’s resurgence.
TRUTH LIVES on at https://sgtreport.tv/
A Look at the Technicals
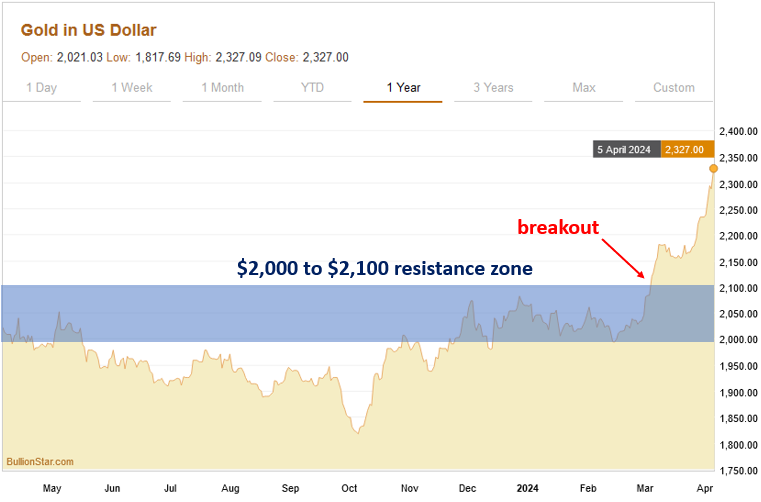
The chart of gold over the past year shows how it suddenly sprang to life over the past month. As I had explained in my last blog post on March 1st, there was an important technical resistance zone from $2,000 to $2,100 that had been acting as a price ceiling for gold since the middle of 2020. Gold’s successful close above that zone signified that a new rally had begun even though the fundamental drivers of it weren’t exactly apparent just yet.
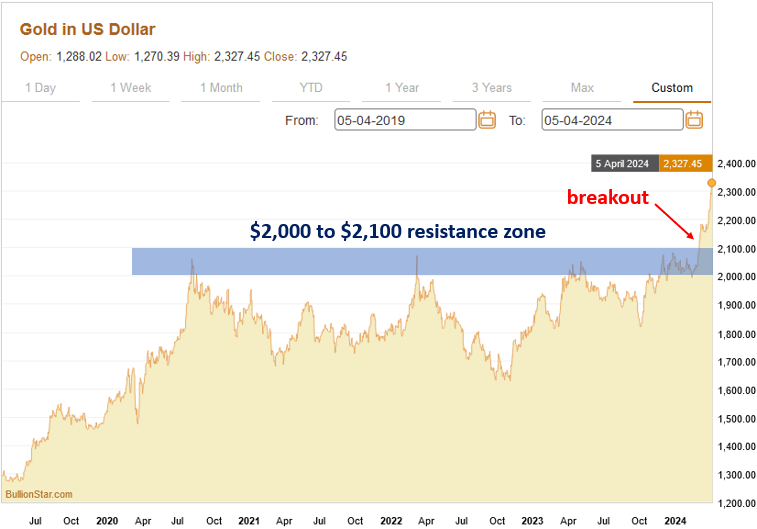
The multi-year gold chart shows the significance of the $2,000 to $2,100 resistance zone and how gold kept bumping its head at that level until it finally pushed through in the past month:
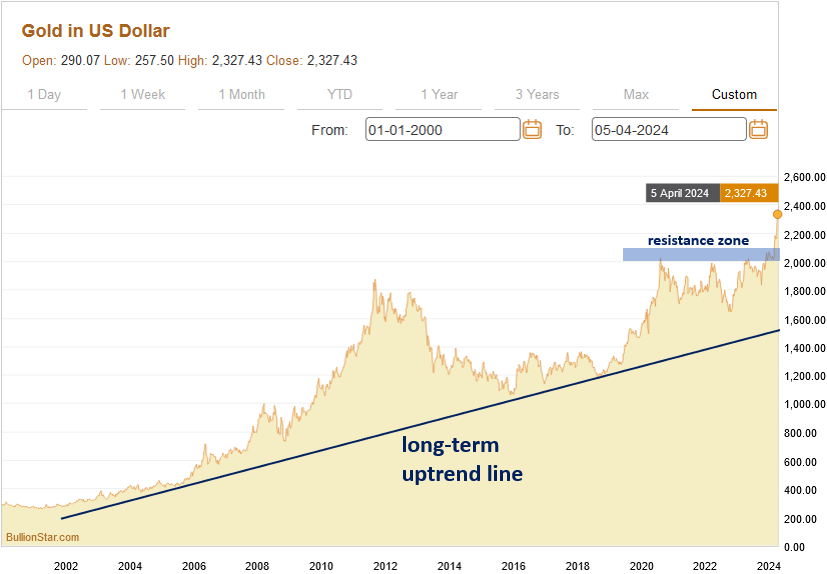
Gold’s multi-decade chart shows that it has been steadily climbing an uptrend line that began in the early-2000s as the U.S. and other countries kicked off an unprecedented debt binge that shows no signs of stopping whatsoever:
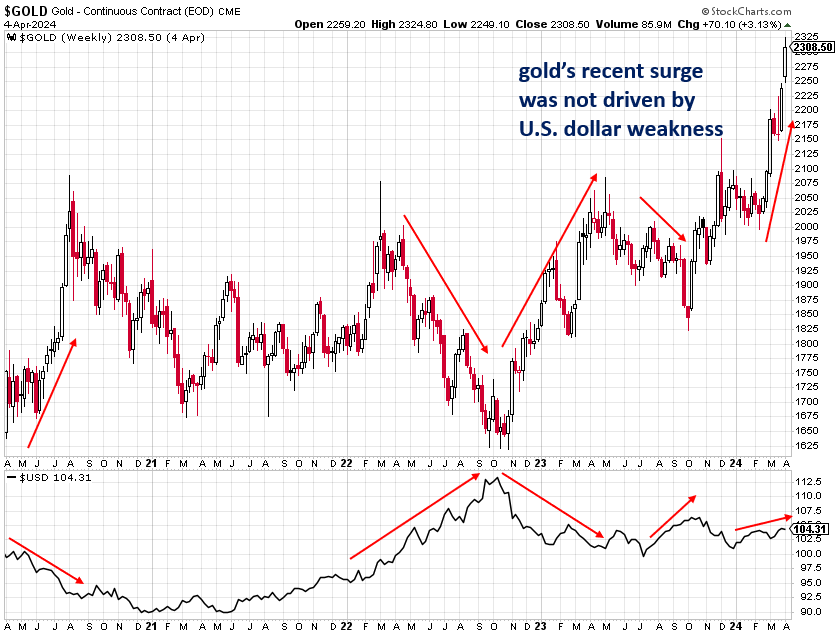
Gold is Rising Despite the Strong U.S. Dollar
What’s particularly interesting and notable about gold’s surge over the past month is how it has occurred independently of the action in the U.S. dollar. Gold and the U.S. dollar have a long-established inverse relationship, which means that strength in the dollar typically causes weakness in gold, while dollar weakness typically causes the price of gold to rise.
The chart below compares gold (the top chart) to the U.S. Dollar Index (the bottom chart) and shows how action in the dollar often causes an opposite trend in gold. Gold’s recent surge took place while the dollar was trending slightly higher, which is a sign of gold’s strength due to its ability to buck the negative influence of the strengthening dollar.
Mainstream Investors & Journalists Missed Gold’s Rally
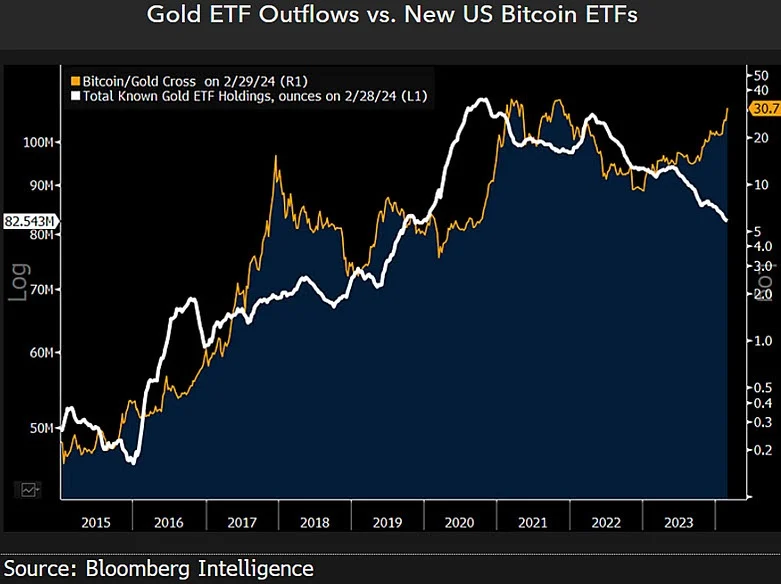
What is also worth noting is how gold’s surprising recent rally has received very little mainstream attention by a press that is much more enamored with hot AI stocks as well as Bitcoin and other cryptocurrencies that have recently benefited from the U.S. government’s approval of a number of Bitcoin exchange-traded funds (ETFs), which has resulted in tremendous inflows from institutional investors and retail investors alike.
As the chart below shows, investors have pulled billions of dollars worth of funds from gold ETFs in order to re-invest in Bitcoin ETFs, which is ironic considering its timing shortly before gold’s liftoff (and is confirmation of contrarian investing principles). The continuation of gold’s bull market will likely lead to funds flowing back into gold ETFs, providing additional fuel for the rally.
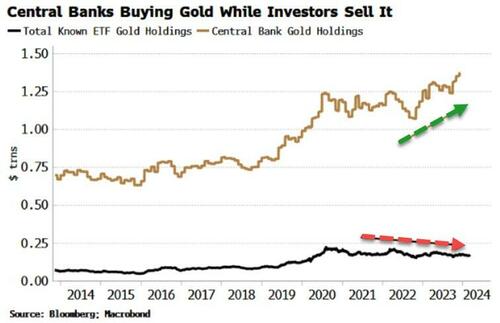
Central Banks Are Steadily Accumulating Gold
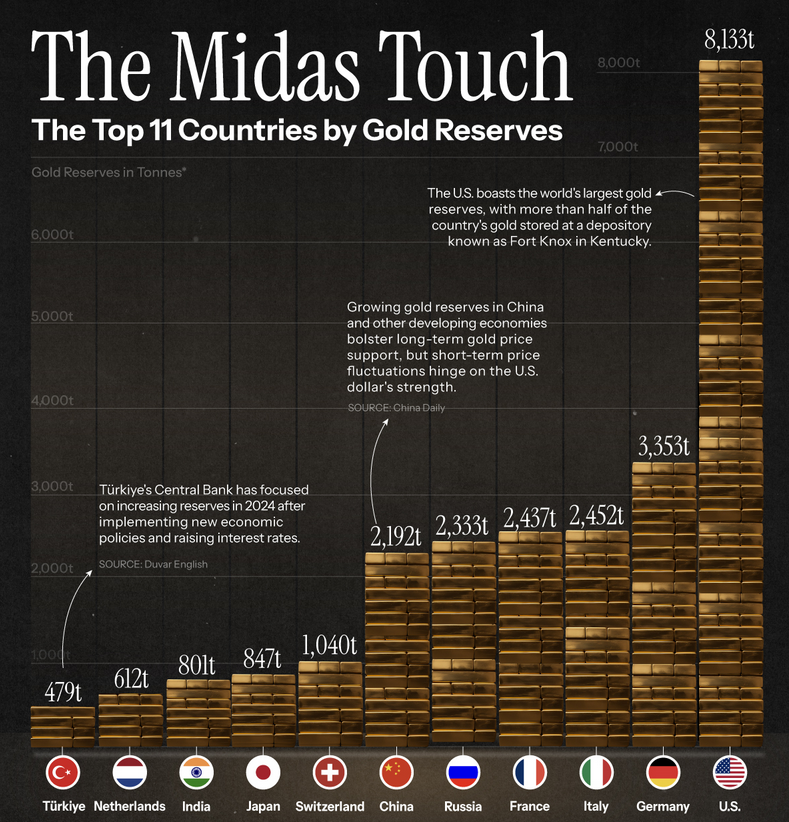
Though Western retail investors (who are often considered to be the “dumb money” in the market) have been sleeping on gold before and even during its surge of the past month, central banks — particularly those in Russia, China, Turkey, and India — have been steadily accumulating practically all of the gold that they can get their hands on. According to the World Gold Council, central banks purchased a healthy 1,037.4 metric tons of gold in 2023 in an effort to diversify out of the U.S. dollar and other fiat currencies that are being debased at an alarming rate and into a hard asset with a six-thousand year history as sound money that cannot be printed.
Though virtually all of the world’s currencies have been downgraded to pure fiat or paper currencies that are not backed by gold since 1971, many of those currencies are indirectly and implicitly backstopped by gold due to the large gold reserves held by many countries. For example, the U.S. officially holds 8,133 metric tons of gold, Germany holds 3,353 metric tons, Italy holds 2,452 metric tons, France holds 2,437 metric tons, Russia holds 2,333 metric tons, and China holds 2,192 metric tons of gold. In a serious currency crisis, a country’s gold reserves is likely to be one of its only saving graces, which is why many countries are accumulating gold at such a rapid pace.