

by Craig Hemke, Sprott Money:
After finishing 2023 on an uptick, the COMEX precious metal prices are once again moving lower and dragging down investor sentiment. Last year we endured similar periods, and most were followed by significant price rallies. As such, are we on the doorstep of the first rally of 2024?
Let’s begin by taking stock of just how poorly the new year has begun:
TRUTH LIVES on at https://sgtreport.tv/
- COMEX gold finished 2023 at $2072. As I type on January 22, it’s trading at $2022. That’s down $50 on the year so far or about 2.5%.
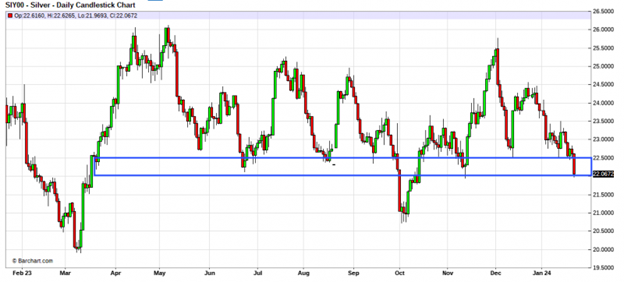
- COMEX silver finished 2023 at $24.09, and it has a last of $22.25 for a year-to-date loss of 7.6%.
- And all of this has had another outsized impact on the mining sector. The GDX finished 2023 at $31.01 but is currently trading at $27.60 for a drop of 11%. Ick.
Investor sentiment has taken a nosedive too. And why wouldn’t it? What other sector in the equity markets is already down 11% YTD?
One way to measure sentiment and momentum is through what’s called the Relative Strength Index. In general, a measure in this index above 70 is considered overly bought or, sometimes, overly optimistic, while a measure below 30 is the opposite.
Where are we currently in terms of RSI? COMEX gold is at 46, but COMEX silver and the GDX are at 33. So, we’re not yet screaming “OVERSOLD” and “BOTTOM” but we’re getting close. What other signs are out there? Let’s look at a couple of other indicators and “fundamentals”.
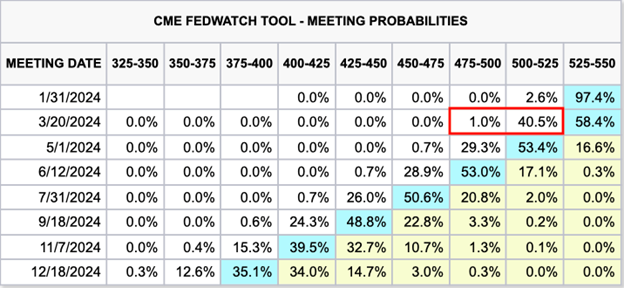
First, as we wrote last week, the markets and the investing public were in major need of a reset of their rate cut expectations as the year began. That has now taken place. Where “the markets” had been almost 90% certain of a fed funds rate cut in March, the consensus is now a more reasonable 40%. The Fed may indeed cut in March, but that meeting is still eight weeks away!
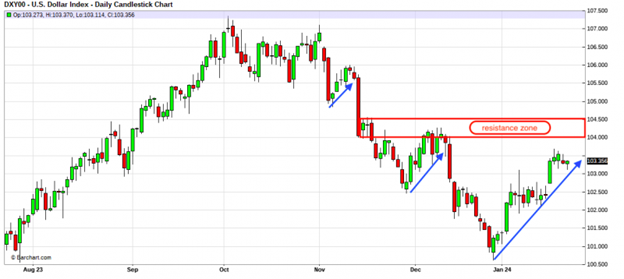
Another factor that has been hindering price the first three weeks of the new year has been a rally in the dollar index. The measure of the US$ versus a basket of other fiat currencies finished 2023 at 101.33, but it currently stands at 103.35 or up about 2%. In general, when the dollar index rallies intraday, the HFT trading machines “see” this happen and respond by selling or shorting COMEX gold and silver contracts. But the opposite is also true and a falling dollar index can provide a tailwind for the metals, so is the index at a spot where it might put in a short-term top?
Take a look below. Yes, this has been a solid bounce in the index, but for now it’s just that—a bounce within an ongoing downtrend. Until it makes a new “higher high” above 104.50, technical analysts will note that the current pattern can be interpreted as simply another “bear flag” consolidation before the downtrend resumes. If the index rolls over here and begins dropping toward 101 again, the COMEX metals will catch a sustained bid.
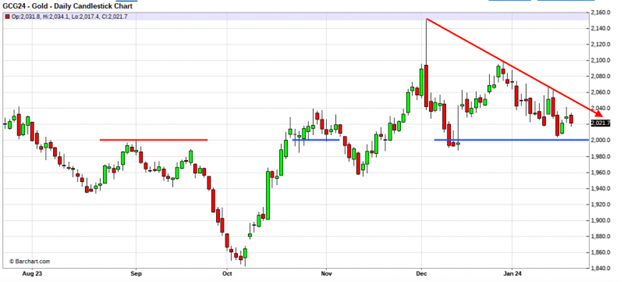
The prices of COMEX gold and silver have also moved into areas where we should expect some support. You might expect this after the losses we’ve seen over the past three weeks. Of course, the charts can never fully tell the tale and lower prices might still be coming, but $2000 gold and $22 silver have been significant support levels before, and I expect that to continue.
The news flow over the next two weeks might work in our favor too. First, the January FOMC meeting will conclude on Wednesday, the 31st, and the past few press conferences from Jerry Powell have been beneficial for precious metal prices. Two days later, on February 2, we’ll get the next U.S. jobs report. Historically, the report for January includes some of the smallest seasonal and birth-death adjustments of the year. As such, could that next report come in “below expectations” and spark renewed hopes for rate cuts?
And lastly, check out this final chart. We’ve already seen how the GDX is down 11% year-to-date. Doing even worse, however, are the shares of the world’s largest gold mining company, Newmont Mining. At a current price of $35.01, it’s down $6.38 on the year or a whopping 15.4%. Yikes!