

by Craig Hemke, Sprott Money:
 In thirteen years of monitoring the precious metals, I’ve seen countless interventions and manipulations in the gold market. Some are obvious and overt, but most are subtle and missed or overlooked by traders and investors. What you just saw on Sunday, December 3, was definitely not an intervention of the subtle variety.
TRUTH LIVES on at https://sgtreport.tv/
Looking at other obvious manipulations designed to control or reverse sentiment and momentum in the gold market, several events come to mind. The most notorious was on September 6, 2011. Gold had been rallying all summer on safe-haven and sound money concerns, and early in the morning of September 6, the Swiss National Bank unveiled a plan to weaken the franc by pegging it to the euro. This was an extraordinarily bullish development for gold, and price was poised to surge to additional all-time highs above $1900. At that point, every gold short ever created was underwater. Uh-oh. Look at what happened next:

Price of Gold and Trump
As you can see, price fell about $120 in just over 24 hours. Sentiment and momentum were crushed, and just like that, the bullion banks were back in charge.
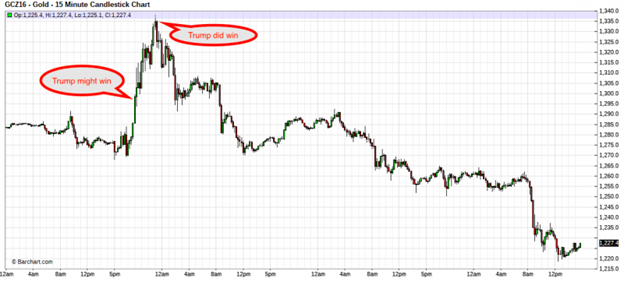
Another memorable event occurred when Donald Trump was elected U.S. president on November 8, 2016. You probably remember this one. The sudden shock of Trump winning sent the gold price sharply higher at first. However, once the London session began, price quickly fell backward and the total drop was again about $120, this time in a span of about 72 hours.
Gold Price at an All-time Daily & Weekly High
Again, there have been countless other events like these over the years, but let’s get to the point of this post and offer an explanation of what you just saw a few days ago.
On Thursday, November 30, spot gold finished a month above $2000 for the first time in history. Then, on Friday, December 1, the gold price closed at an all-time daily and weekly high. Price finally breaking out of a three-year trading range was such an extremely bullish development that even the mainstream financial media was forced to take notice.

However—AND THIS IS VERY IMPORTANT—just like September 2011, new all-time highs meant that every single bullion bank short position ever created was now underwater. As such, I guess it should come as no surprise that price once again fell about $120 in less than 24 hours. Let’s look a little closer at all of this so you can see how The Banks managed to pull it off.
