

by Jan Nieuwenhuijs, Gold Seek:
This is part one of a series on COMEX gold futures contracts, for those interested to reach a proper understanding on this section of the gold market. In this first part we will discuss the history of futures trading and the basics of COMEX gold futures.
The History of Futures Trading
According to various sources the first traces of futures trading have been found in ancient Greece, medieval Europe, and seventeenth-century Japan. Though futures markets as we know them today emerged from North American commodity trade in the nineteenth century.
TRUTH LIVES on at https://sgtreport.tv/
In 1848 workers completed the 96 miles long Illinois and Michigan Canal that connected the Chicago and Illinois Rivers, thus linking the Great Lakes to the Mississippi River. Through this canal Chicago was established as a trading hub just before railroads arrived. The agricultural harvest of the Illinois River valley that previously flowed downstream to St. Louis and New Orleans was now transported to Chicago and onwards to New York through the Erie Canal.
Because of to the local weather in Chicago, temperatures swung from hot humid summers to bitter cold winters. At times, merchants couldn’t transport crops produced in the river valley to Chicago, as the river and canal were frozen. Corn was stored in cribs until the ice melted. As soon as the waterways opened the markets in Chicago were overwhelmed by supply and prices tumbled.
Amidst these dynamics a merchant offered a producer in Chicago to deliver 3,000 bushels of corn three months later for 1 cent cheaper than the prevailing spot price. The producer agreed, and so on March 13, 1851, the first such timed contract was signed—or so the story goes. Some years later, in 1865, farmers, producers, merchants, and speculators began trading standardized futures contracts on the Chicago Board of Trade (CBOT). The first futures exchange that is similar to exchanges as they are currently organized with a clearing house appeared in 1891 in the United States.
Since Nixon closed the gold window in 1971, ending the era of fixed exchange rates, the underlying assets of futures expanded from commodities to currencies, stock indices, bonds, Eurodollars, crypto, and more. Gold futures were launched in 1974.
An Introduction to Gold Futures
A futures contract represents an agreement to make or take delivery of a specific quantity and quality of an asset at a specified future delivery month, with price as the only variable. Notwithstanding certain futures contracts are cash settled. Futures are standardized so they are fungible and can be centrally cleared.
By and far, the most traded gold futures contract globally is listed on the COMEX (the Exchange hereafter), a subsidiary of CME Group. Below is a summary of the specifications of this contract:
Contract size: 100 troy ounces
Price quotation: US dollars per troy ounce
Product code: GC
Listed contracts: Monthly contracts are listed for the nearest 3 consecutive months, any February, April, August, October in the nearest 23 months, and any June and December in the nearest 72 months.
Settlement method: Physical delivery at COMEX approved depositories in New York or Delaware.
Delivery period: Delivery may take place on any business day of the delivery month.
Contracts are not listed for every month six years into the future, as to concentrate trading in fewer months which improves liquidity. Delivery can be made in one 100-ounce bar or three 1-kilogram bars, having a fineness of no less than 995 parts per thousand. Of course, the buyer only pays for fine ounces delivered. The most actively traded months are February, April, June, August, and December.
Nowadays all trading is done electronically through CME’s Globex platform. Every contract month is traded through an order book where buy and sell orders are connected. Market makers—among other traders—quote limit order bids to signal the market at what price and in which quantity they want to buy, and limit order asks to signal at what price and in which quantity they want to sell. All together these limit order bids and asks comprise the order book. Market takers submit “market with protection orders” (simulating plain market orders), notifying the Exchange in what quantity they want to buy or sell at the best price. Once the Exchange has matched market to limit orders, they are being filled and the price moves.
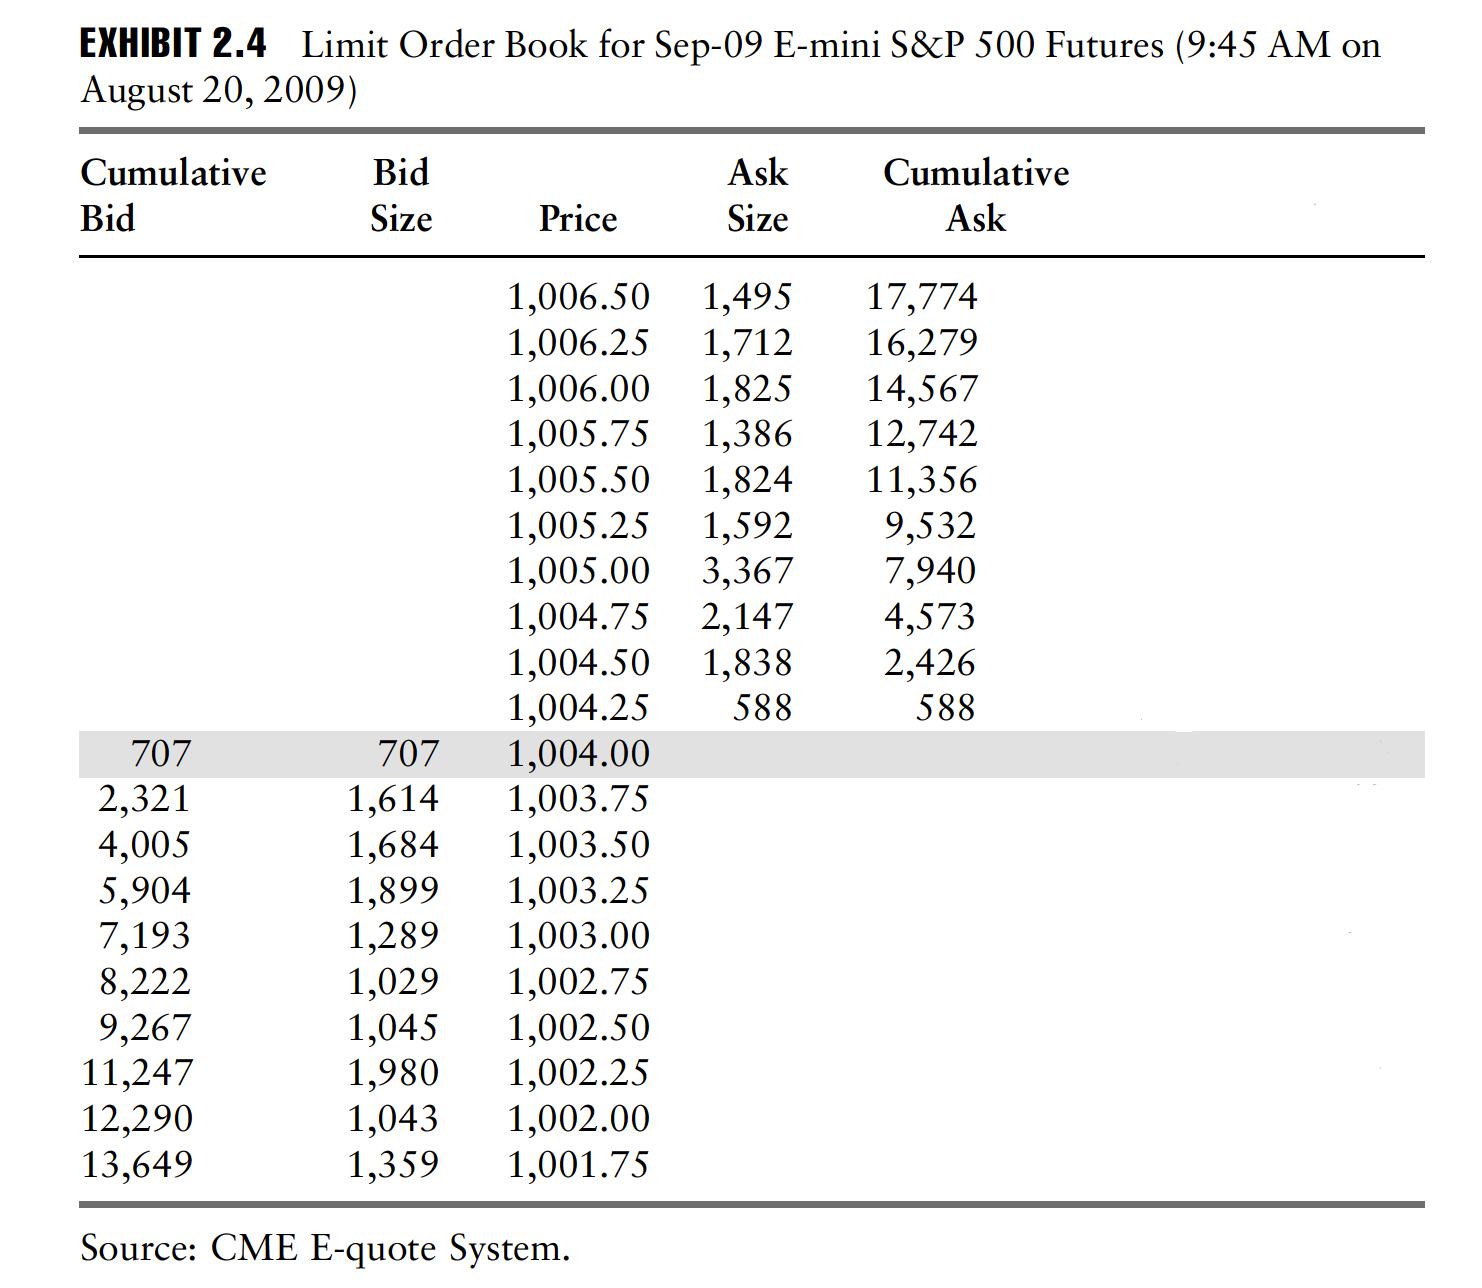
Example order book of S&P 500 index futures.
Above is an example order book of S&P500 index futures (the September 2009 contract), courtesy of The CME Group Risk Management Handbook. The highest bid in this example is $1,004.00 dollars, and the lowest ask is $1,004.25. The bid-ask spread and the cumulative order quantities disclosed indicate market liquidity (the ease with which an asset or security can be bought or sold without significantly affecting its price).
Every futures trade involves a buyer and a seller signing one or multiple contracts to take and make delivery in the future. Opening a position is referred to as “buy long” or “sell short.” A contract’s trading volume is set by how many contracts are signed during a particular timeframe. The open interest (OI) reflects how many contracts are outstanding at any given point in time. The number of outstanding longs and shorts for any contract is equal, because for every buyer there is a seller. On the COMEX both volume and OI are counted single sided. In example, an OI of 16 means there are 16 longs and 16 shorts.
Charting the prices of listed contract months reveals the futures curve.
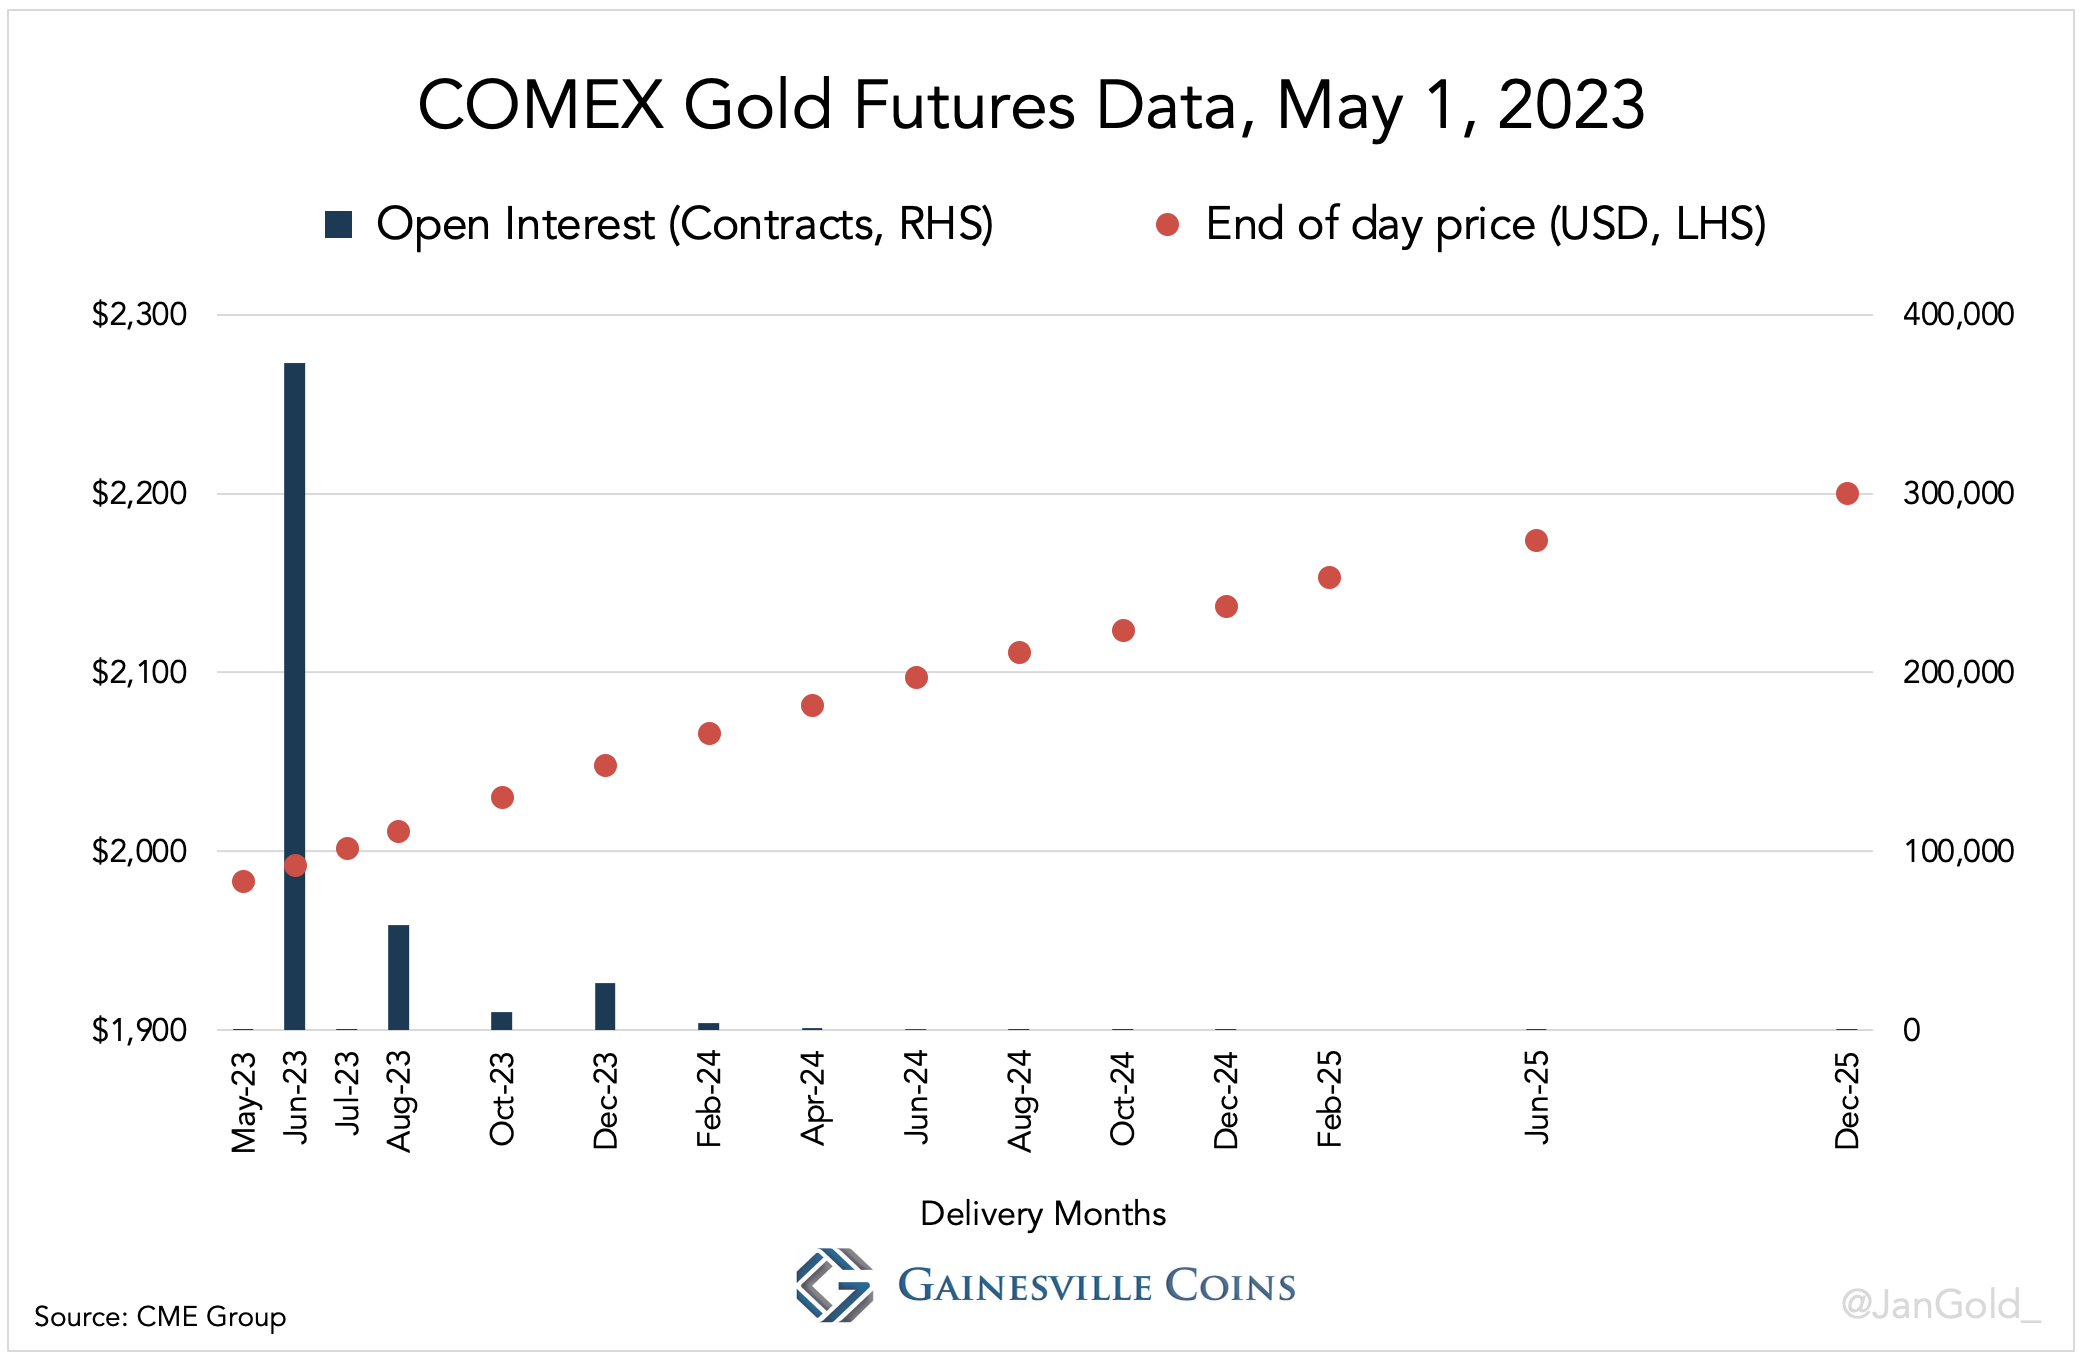
COMEX gold futures prices three years out on May 1, 2023, and the open interest for every contract month. As time progresses new contracts are listed at the end of the futures curve, while nearby contracts at the front of the curve expire and are delisted.
The futures curve shows if contract months trade at a premium or discount to the spot price. If the curve slopes upward (successive months are priced higher) the futures market is said to be in “contango.” In contrast, if the curve slopes downward the market is said to be in “backwardation.” Which variables shape the curve differs per asset. The shape of the gold futures curve can depend on storage costs, the US dollar interest rate, the gold lease rate, expectations about the gold price in the future, and scarcity in the spot versus futures market.
Important to understand is that futures prices do not determine the spot price of any asset in the future. For some assets, such as eggs, futures prices do reflect the market’s forecast of the spot price in the future, which may or may not turn out to be accurate, but for other assets the market composes the curve based on alternative models.