

by Peter Schiff, Schiff Gold:
![]() The Federal Government ran a deficit last month of $240B. Revenue continues to be at or below levels last year while expenses continue to grow.
The Federal Government ran a deficit last month of $240B. Revenue continues to be at or below levels last year while expenses continue to grow.
The chart below shows the month of May historically. This is the second largest May deficit ever, falling only behind May 2020 during the peak of Covid stimulus. As the chart below shows, revenues have dropped significantly YoY since the peak in 2021. At the same time, expenses dropped last year but have bounced back this year.
TRUTH LIVES on at https://sgtreport.tv/
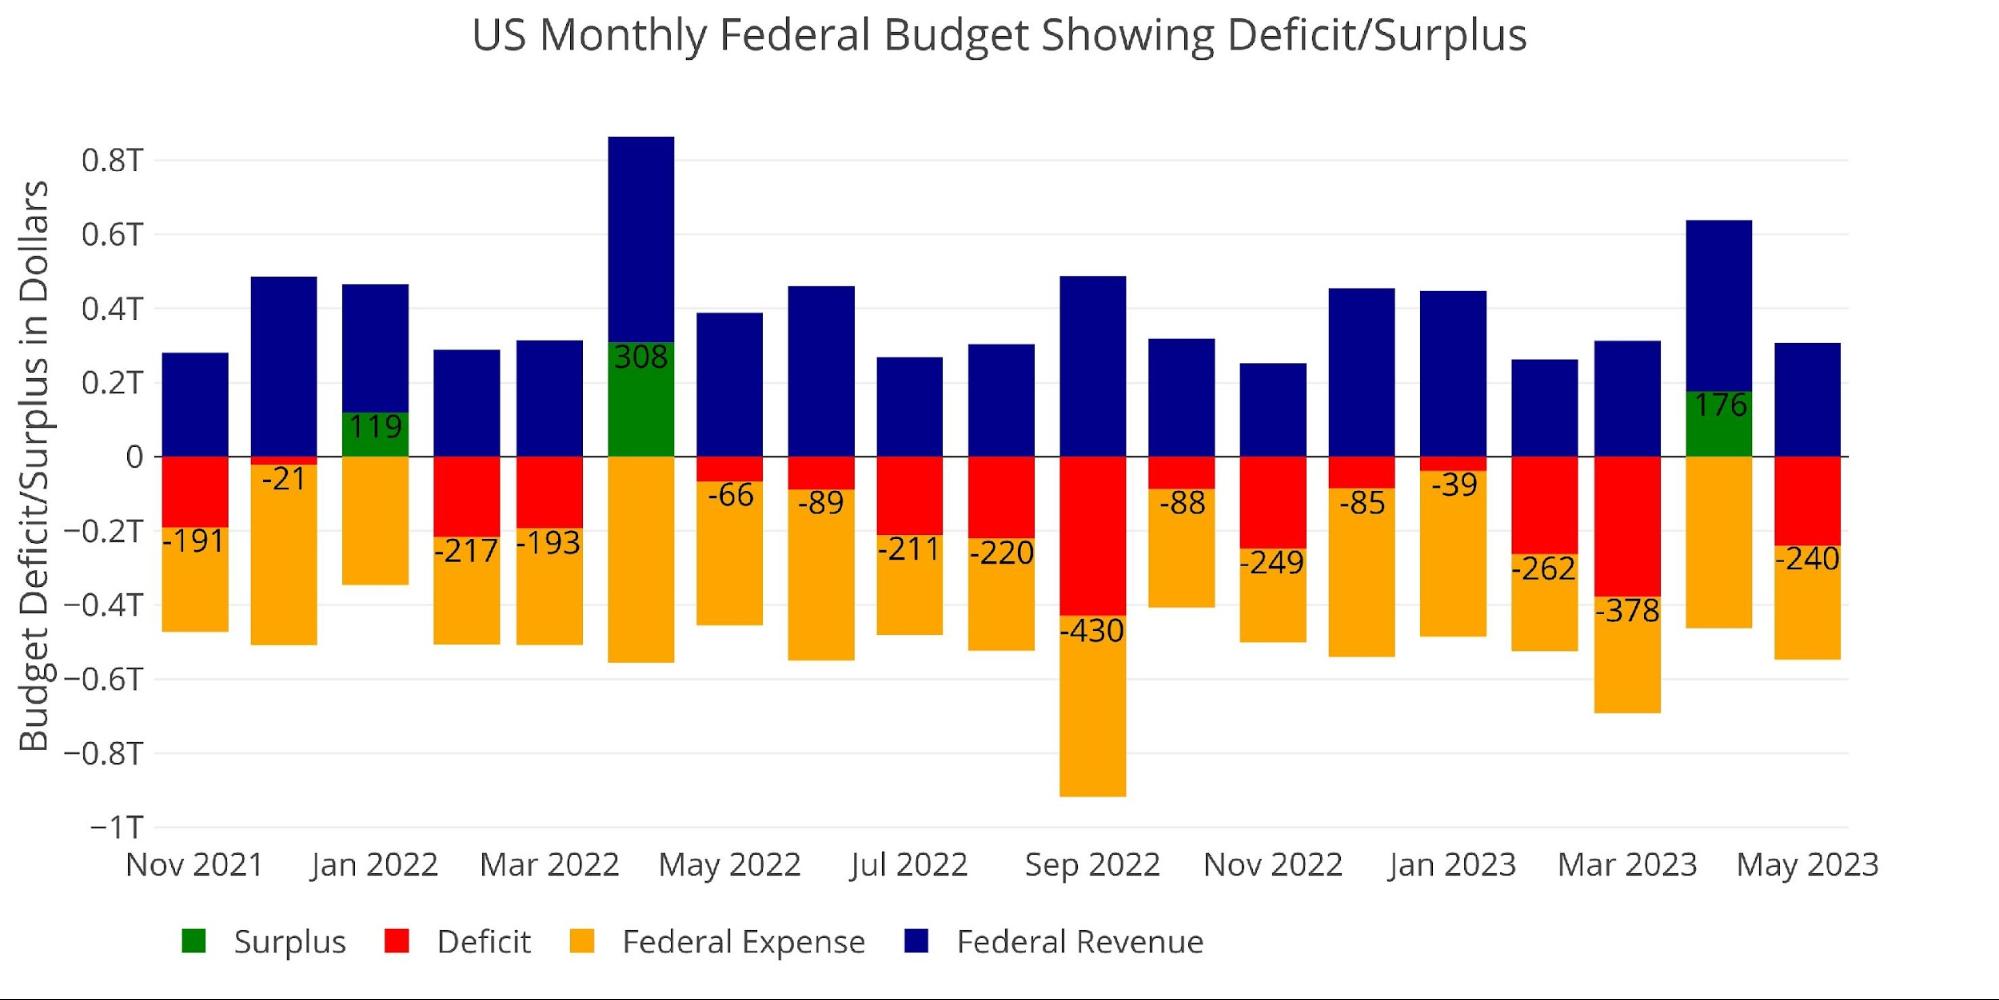
Figure: 1 Monthly Federal Budget
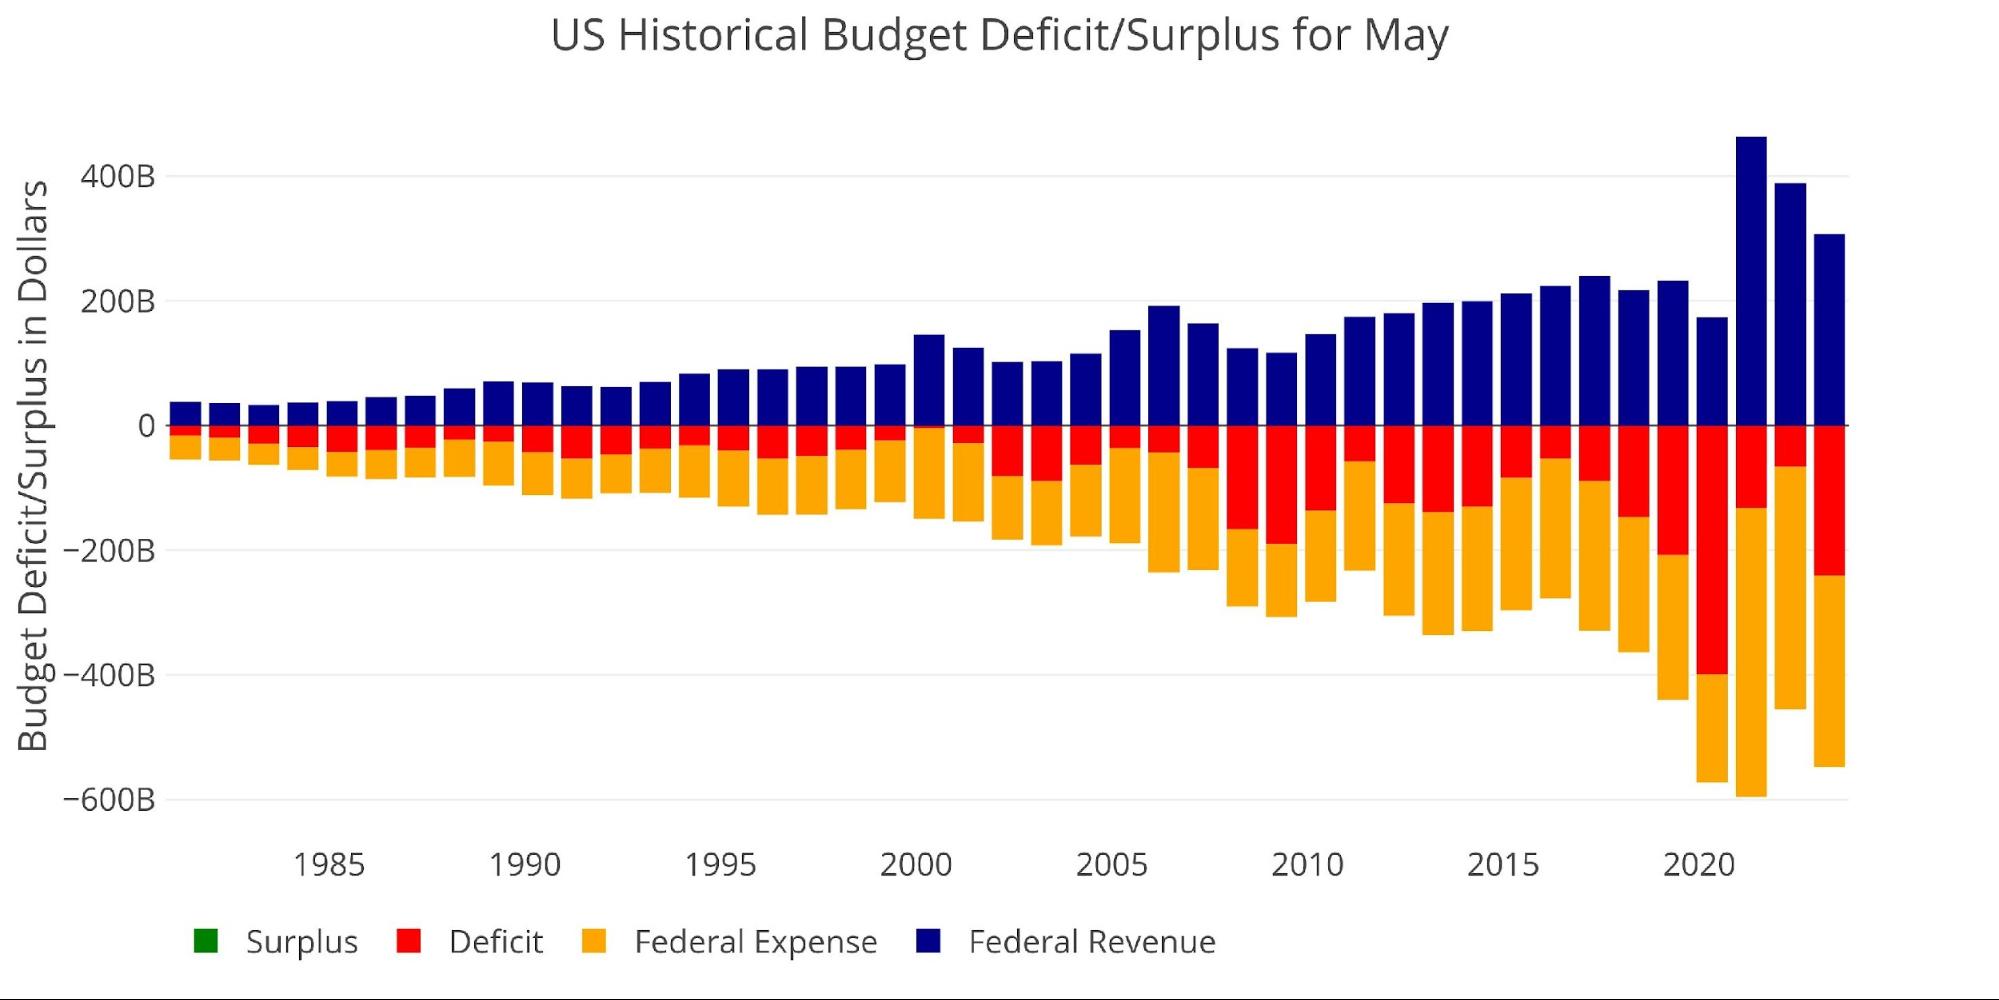
Figure: 2 Historical Deficit/Surplus for May
Looking over the ten years before Covid, the May deficit averaged $116B which is less than half the amount this year.
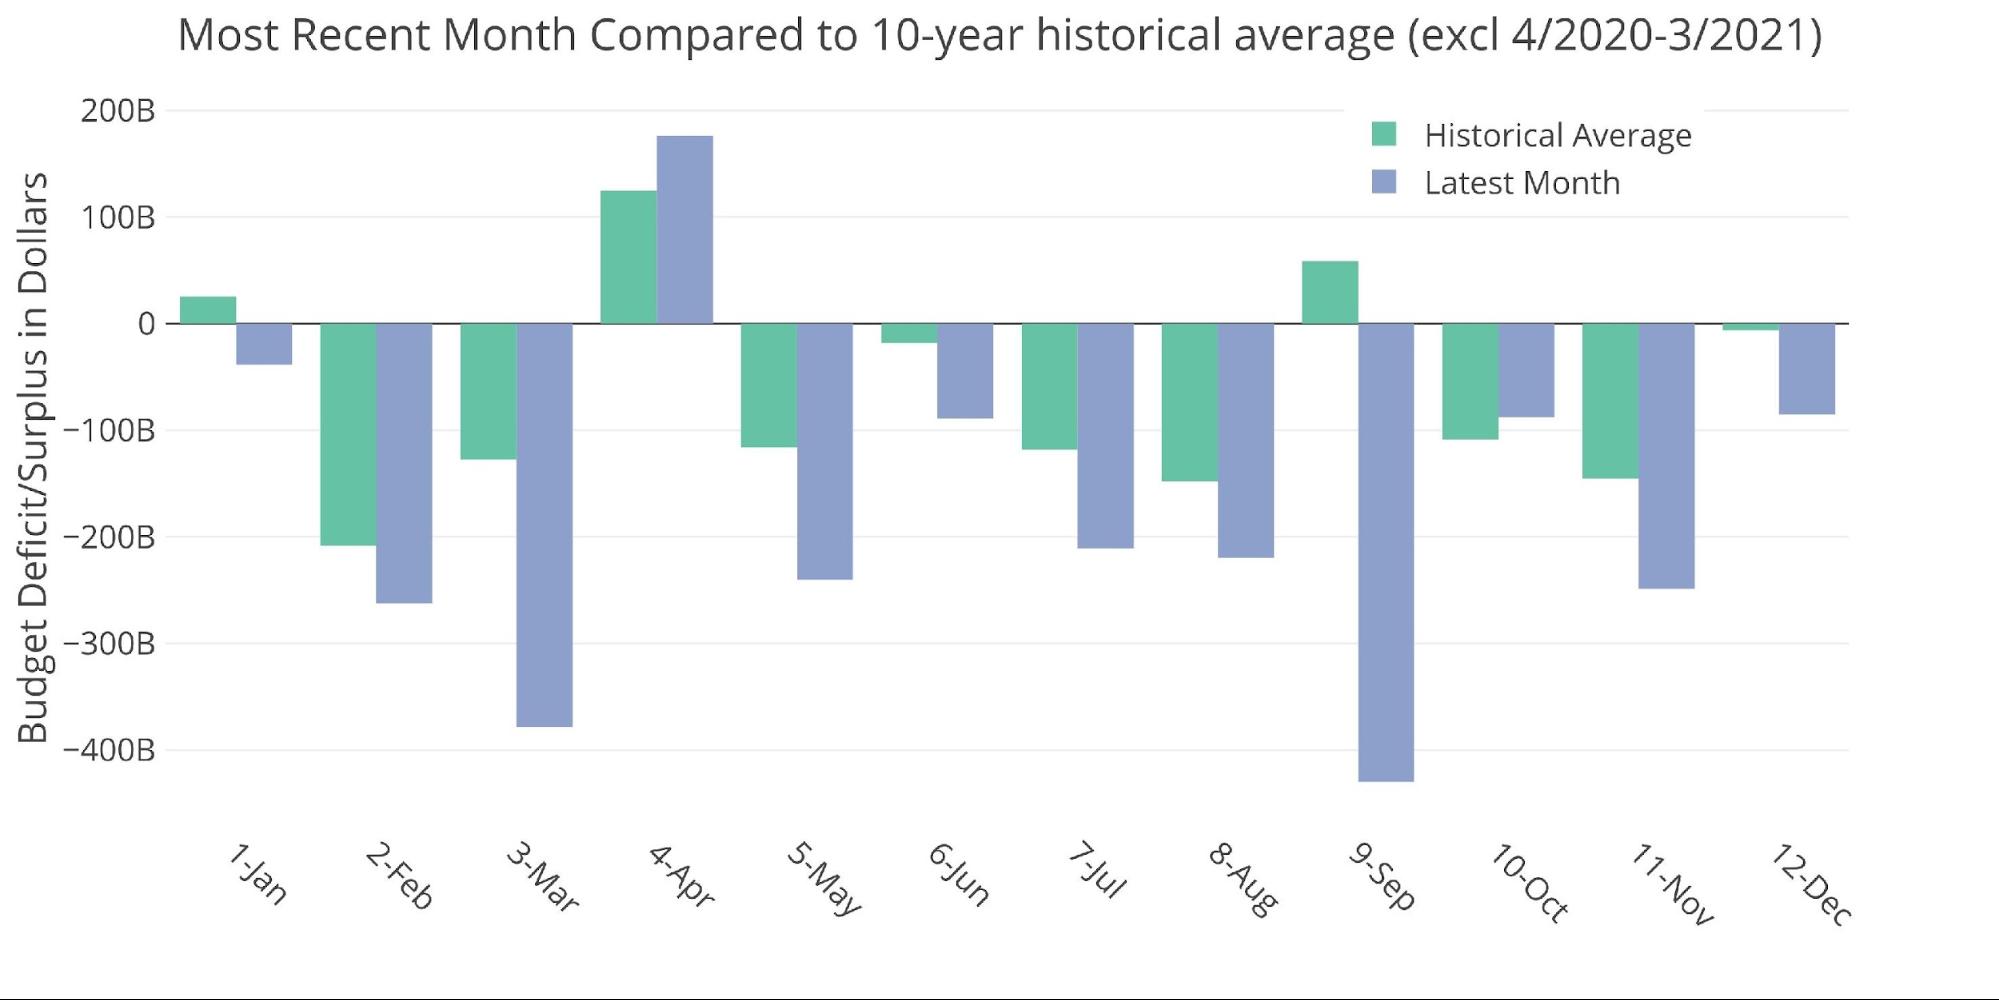
Figure: 3 Current vs Historical
The Sankey diagram below shows the distribution of spending and revenue. The deficit represented almost 44% of total expenses.
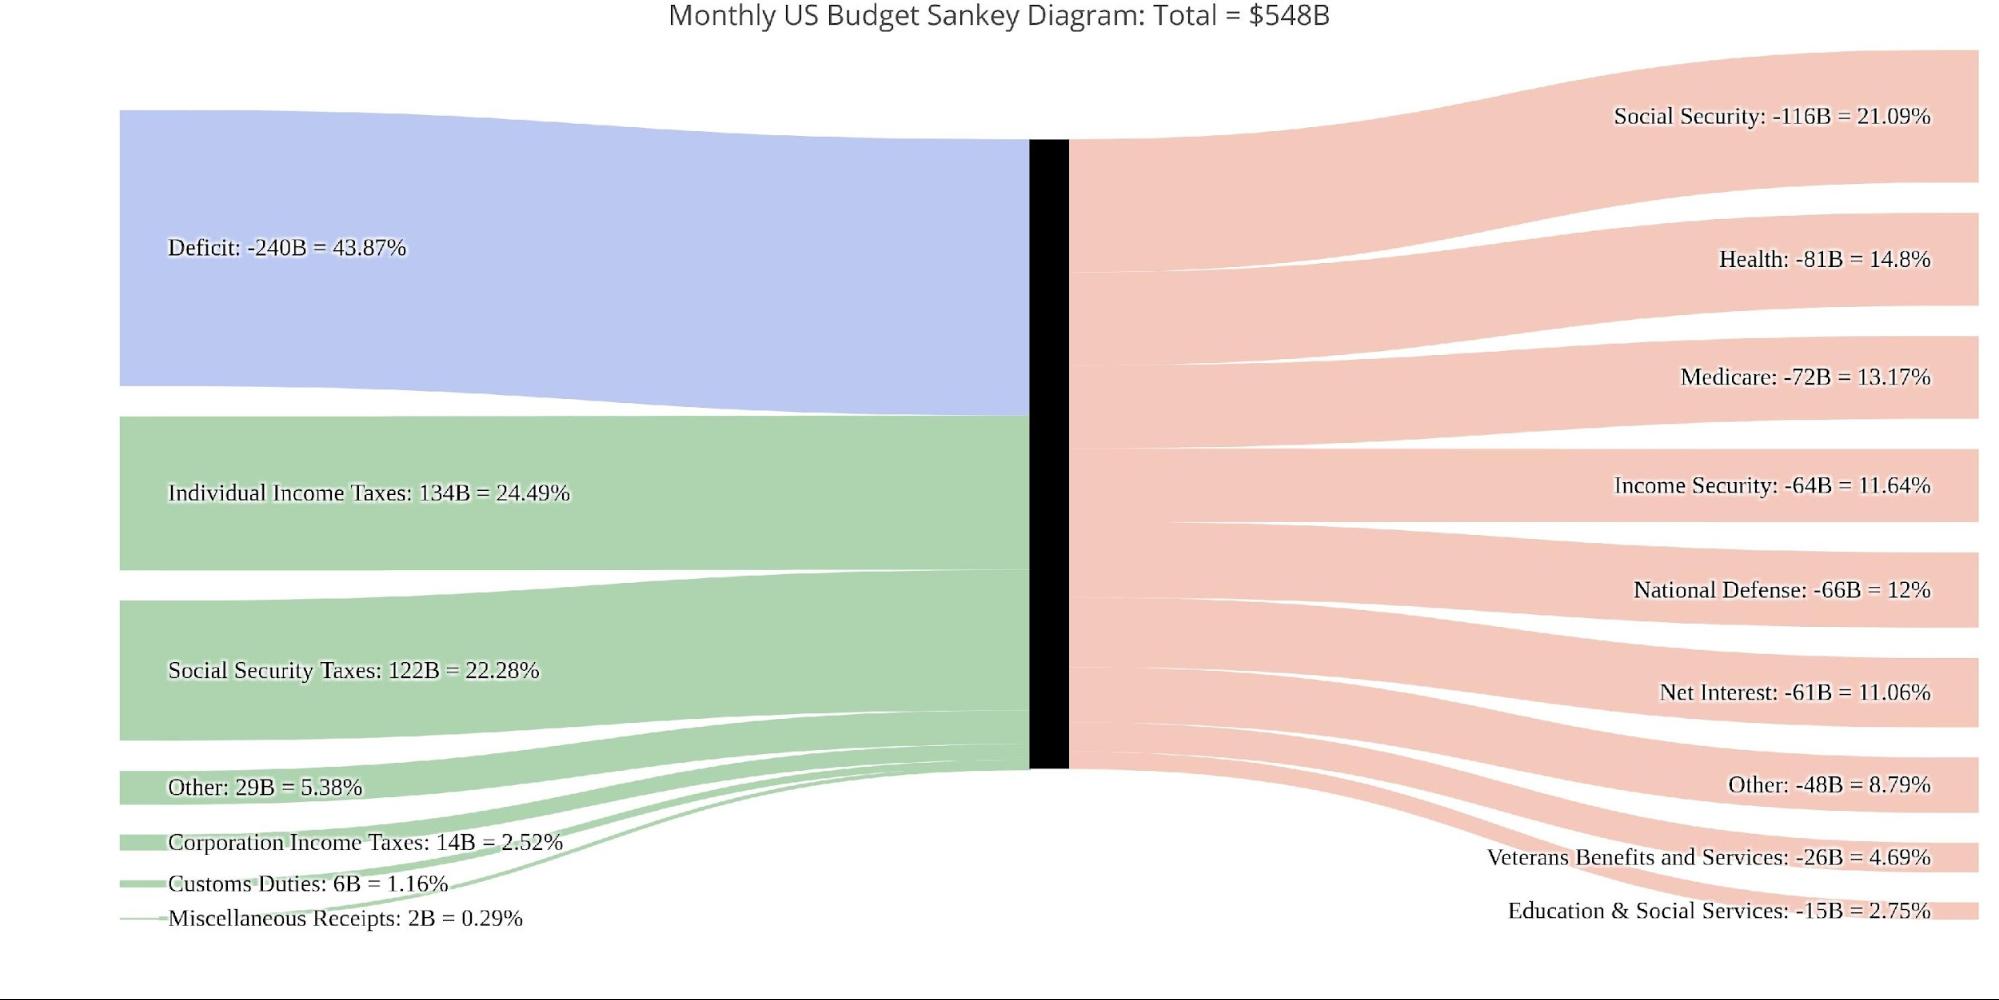
Figure: 4 Monthly Federal Budget Sankey
This is greater than the distribution over the TTM which represents 32% of expenses. This means the budget deficit is clearly getting worse in a hurry.
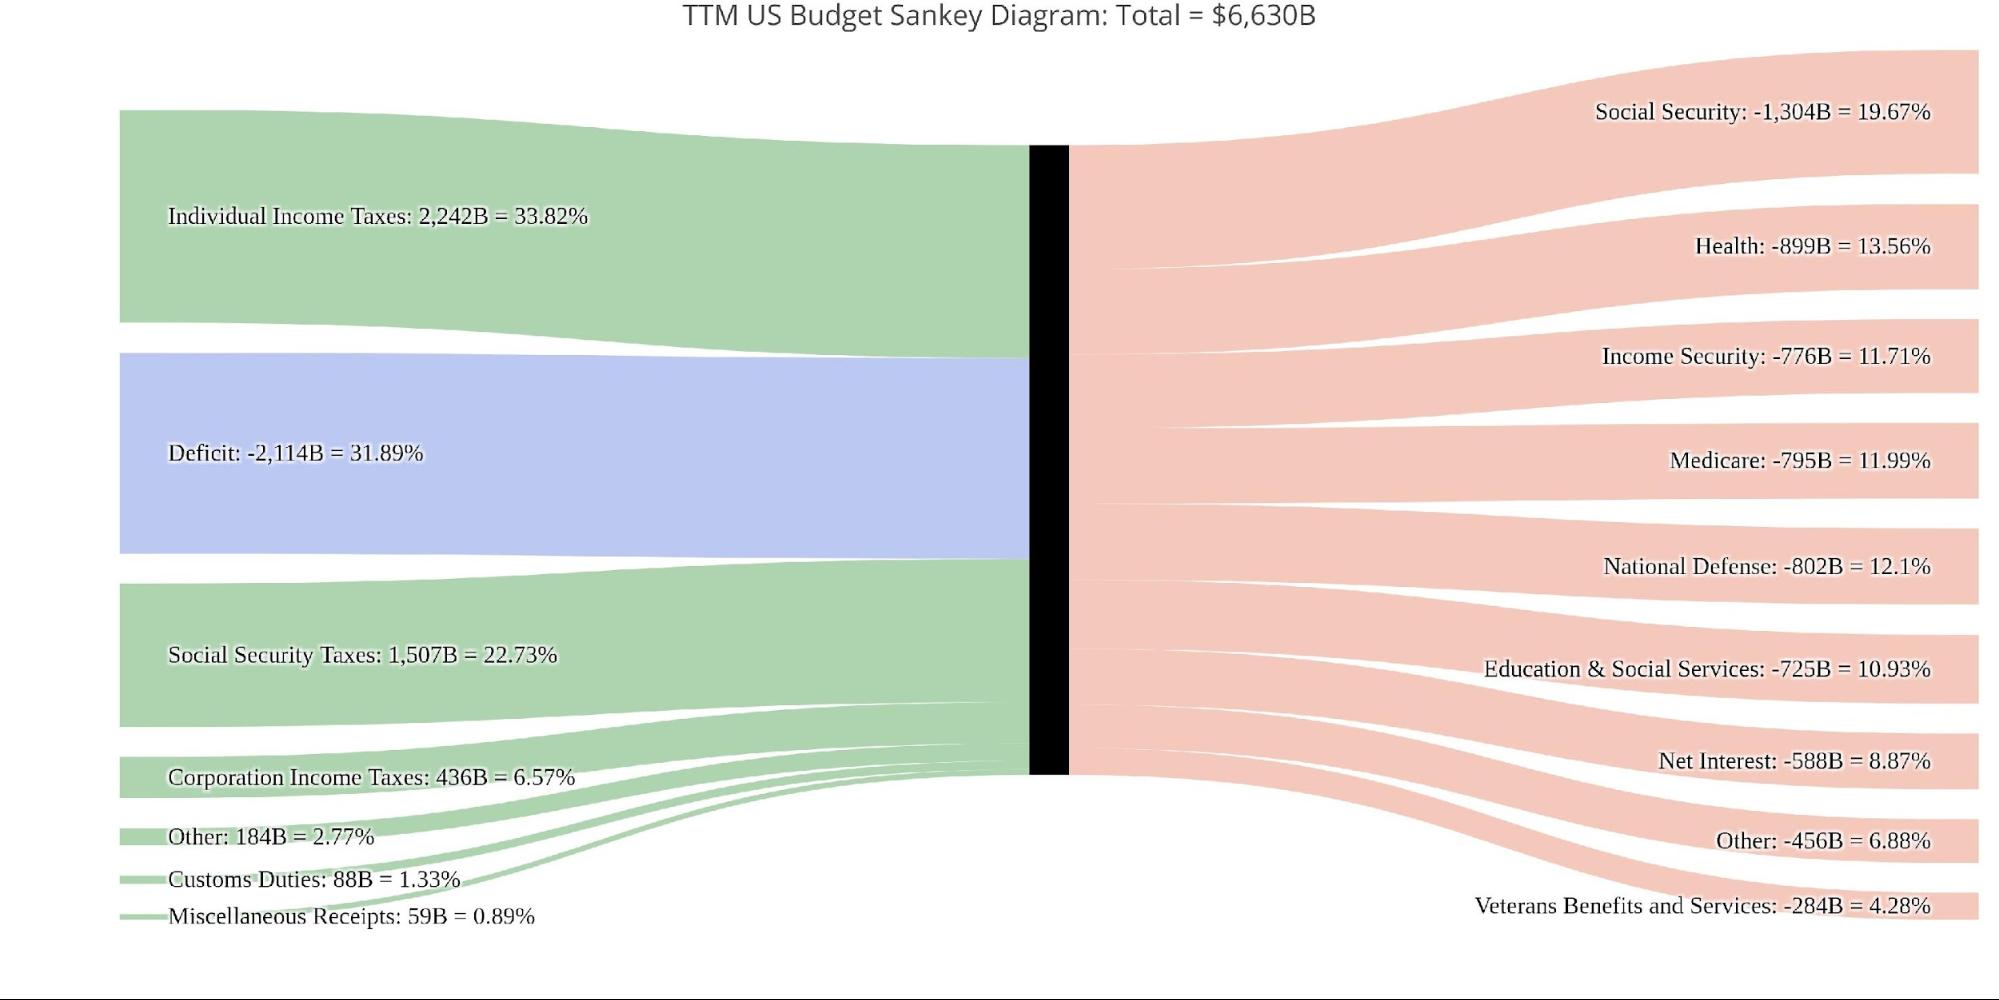
Figure: 5 TTM Federal Budget Sankey
The revenue this year has been shrinking on average when looking over the last three years.

Figure: 6 Monthly Receipts
At the same time, expenses continue at elevated levels.
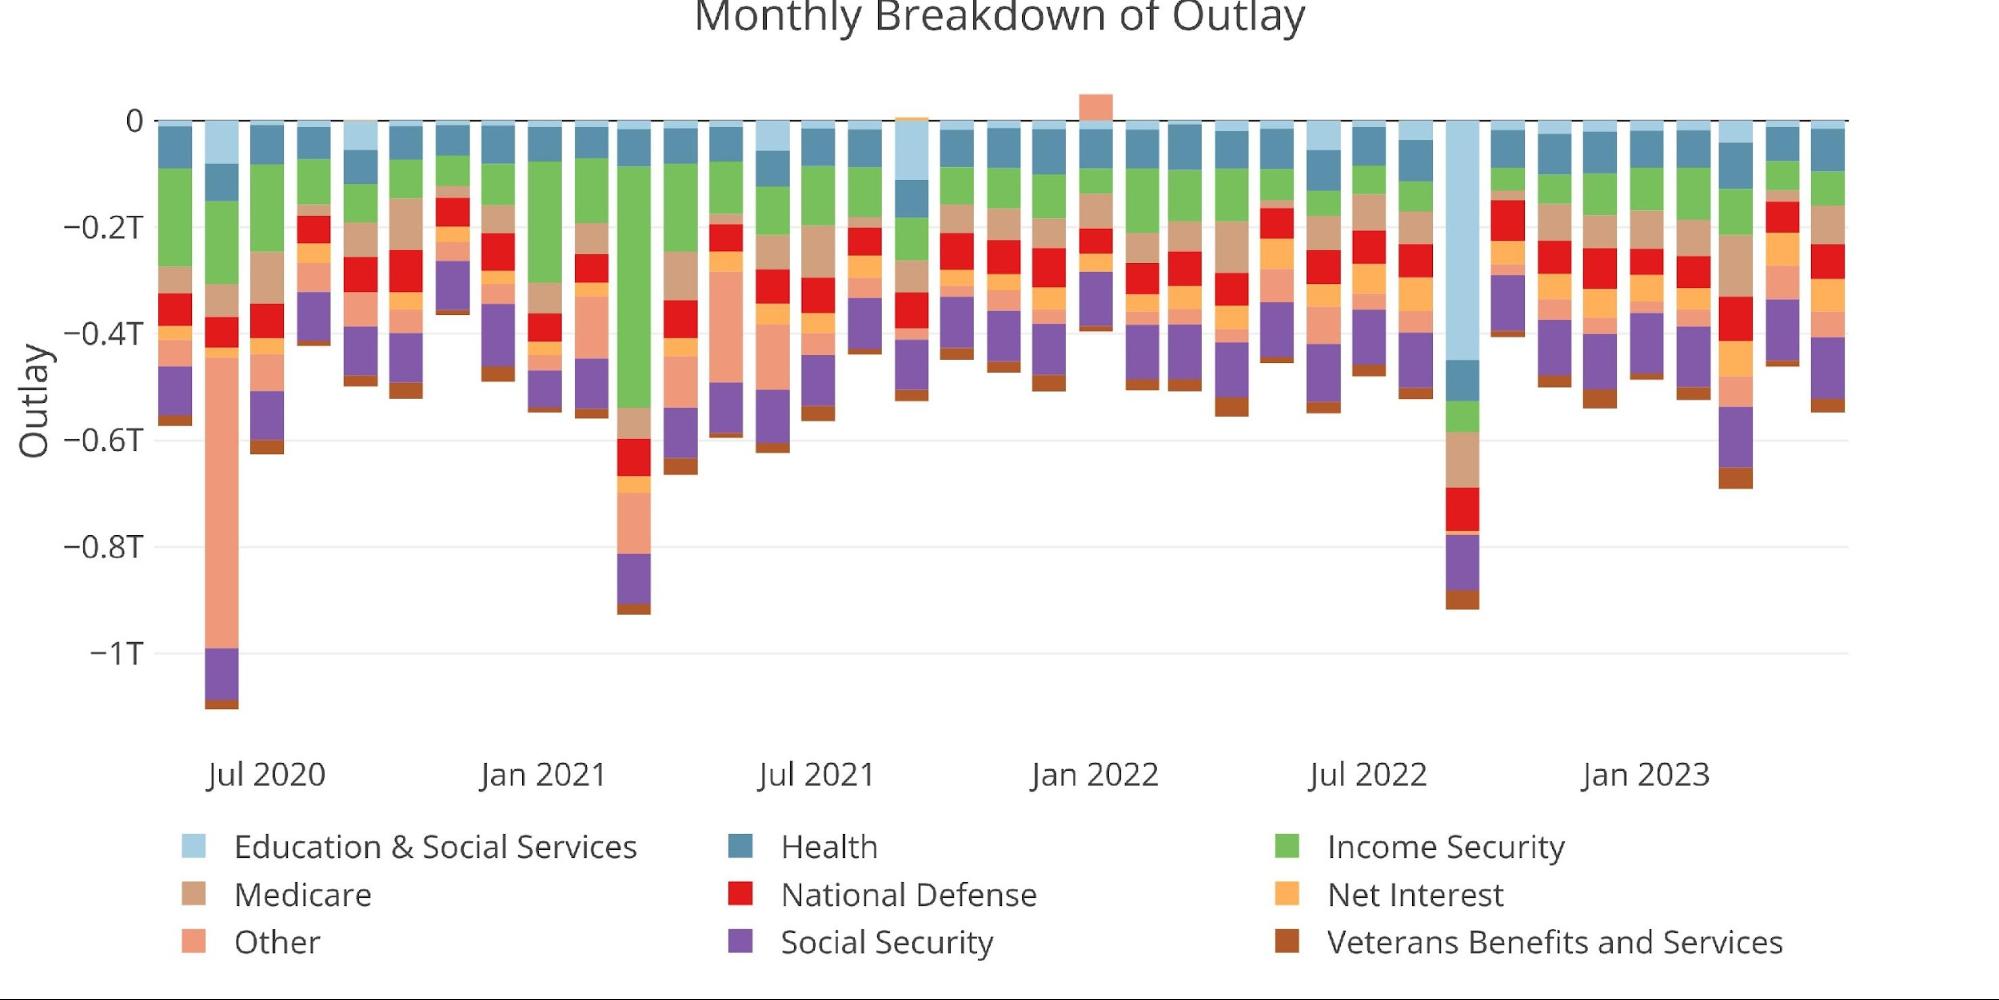
Figure: 7 Monthly Outlays
One expense that continues to be a major issue for the Treasury is Net Interest Expense. The chart below shows how it has changed over the last several years. In the latest month, it clocked in just below $600B. This is up from $350B at the start of 2022, less than 18 months ago. The government has added an extra $250B in expenses per year on just debt service.
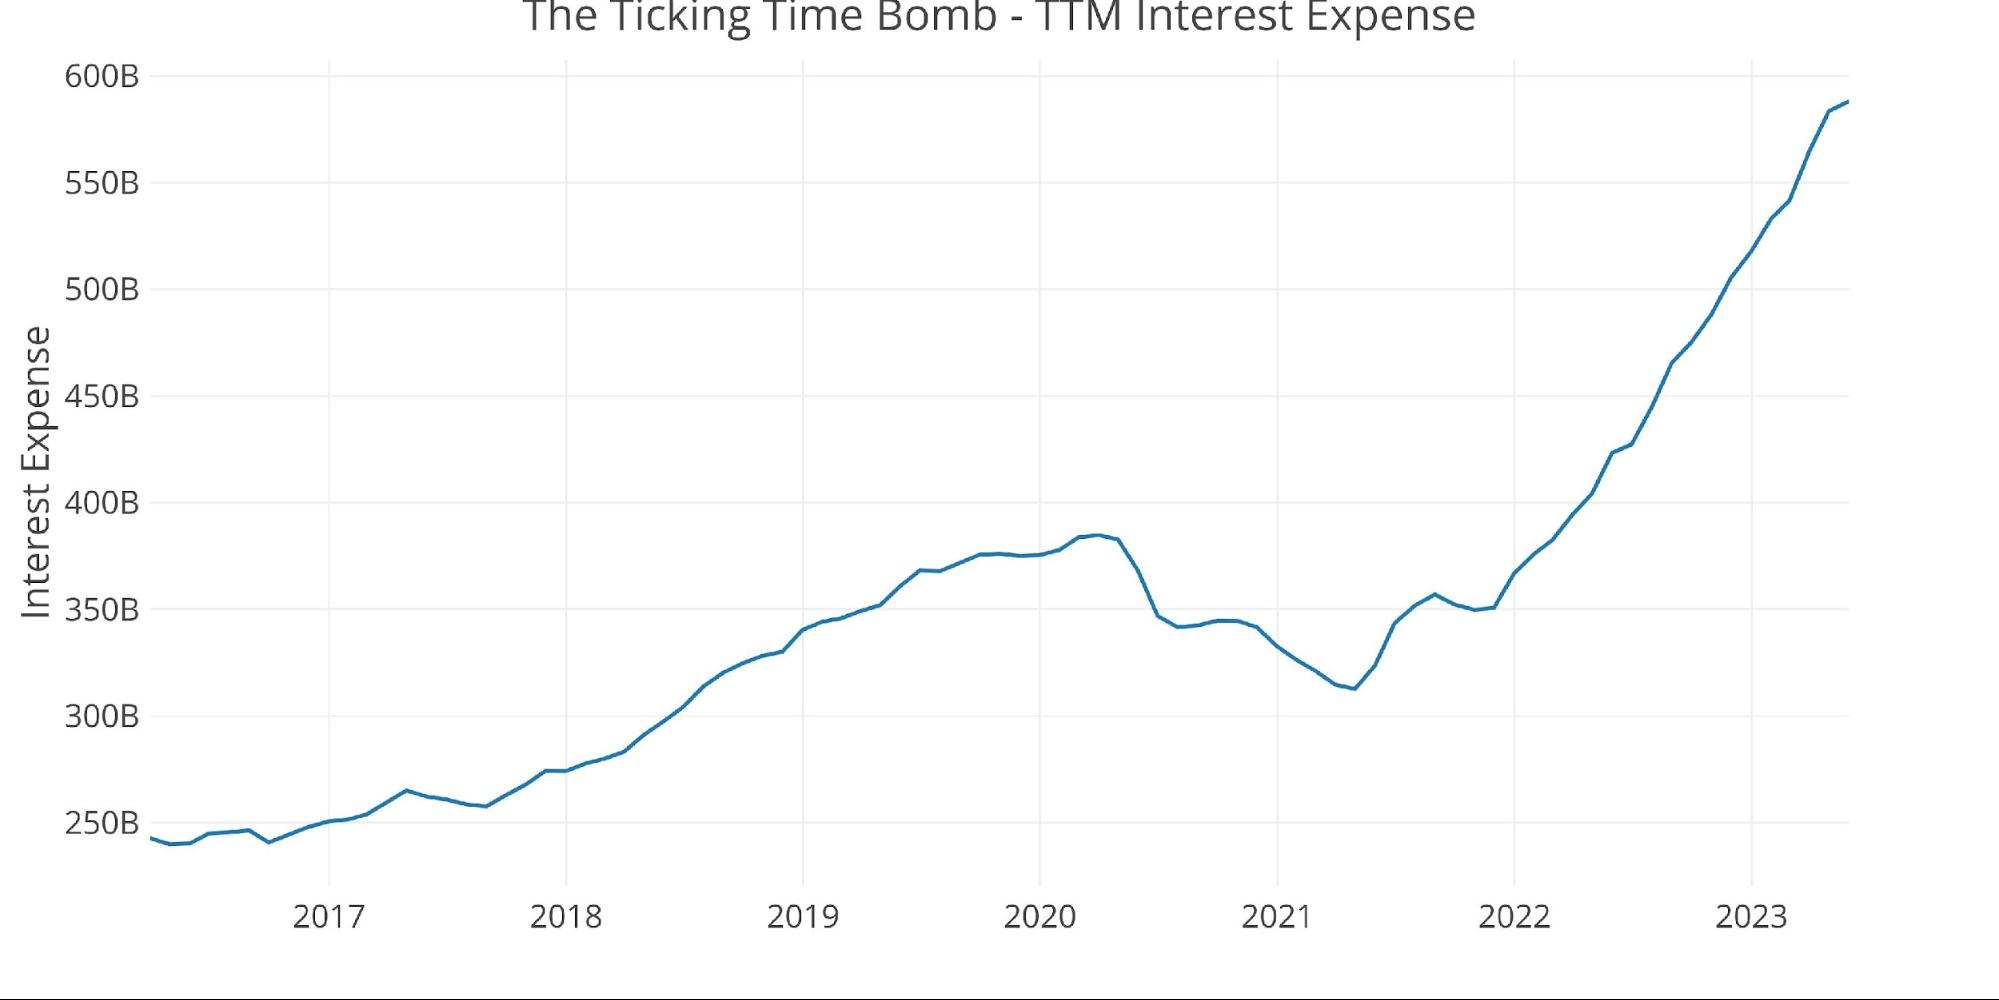
Figure: 8 TTM Interest Expense
The table below goes deeper into the numbers of each category. The key takeaways from the charts and table:
Outlays
-
- Almost all spending categories increased YoY except for Other and Education.
-
- On a TTM basis, all expenses have increased except for Income Security. The increase has been double digits for 6 categories.
-
- Net Interest is up 8.2% YoY and up 39% on a TTM basis
- Almost all spending categories increased YoY except for Other and Education.
Receipts
- Individual Income Taxes fell an incredible 38.1%% YoY
-
- A more discouraging trend (or encouraging if you are a taxpayer) is that Individual Tax Revenues were down on a TTM basis by 15.5%.
-
- Social Security taxes were up 14.5% on a TTM basis which definitely is hurting the middle class and further evidence of the bite inflation is taking
Total
- On a TTM basis – Outlays were up 11.5% with Receipts down 6.2%.
-
- This caused the TTM deficit to surge an incredible $980B or 86.3%!
- The TTM deficit now exceeds $2.1T
-
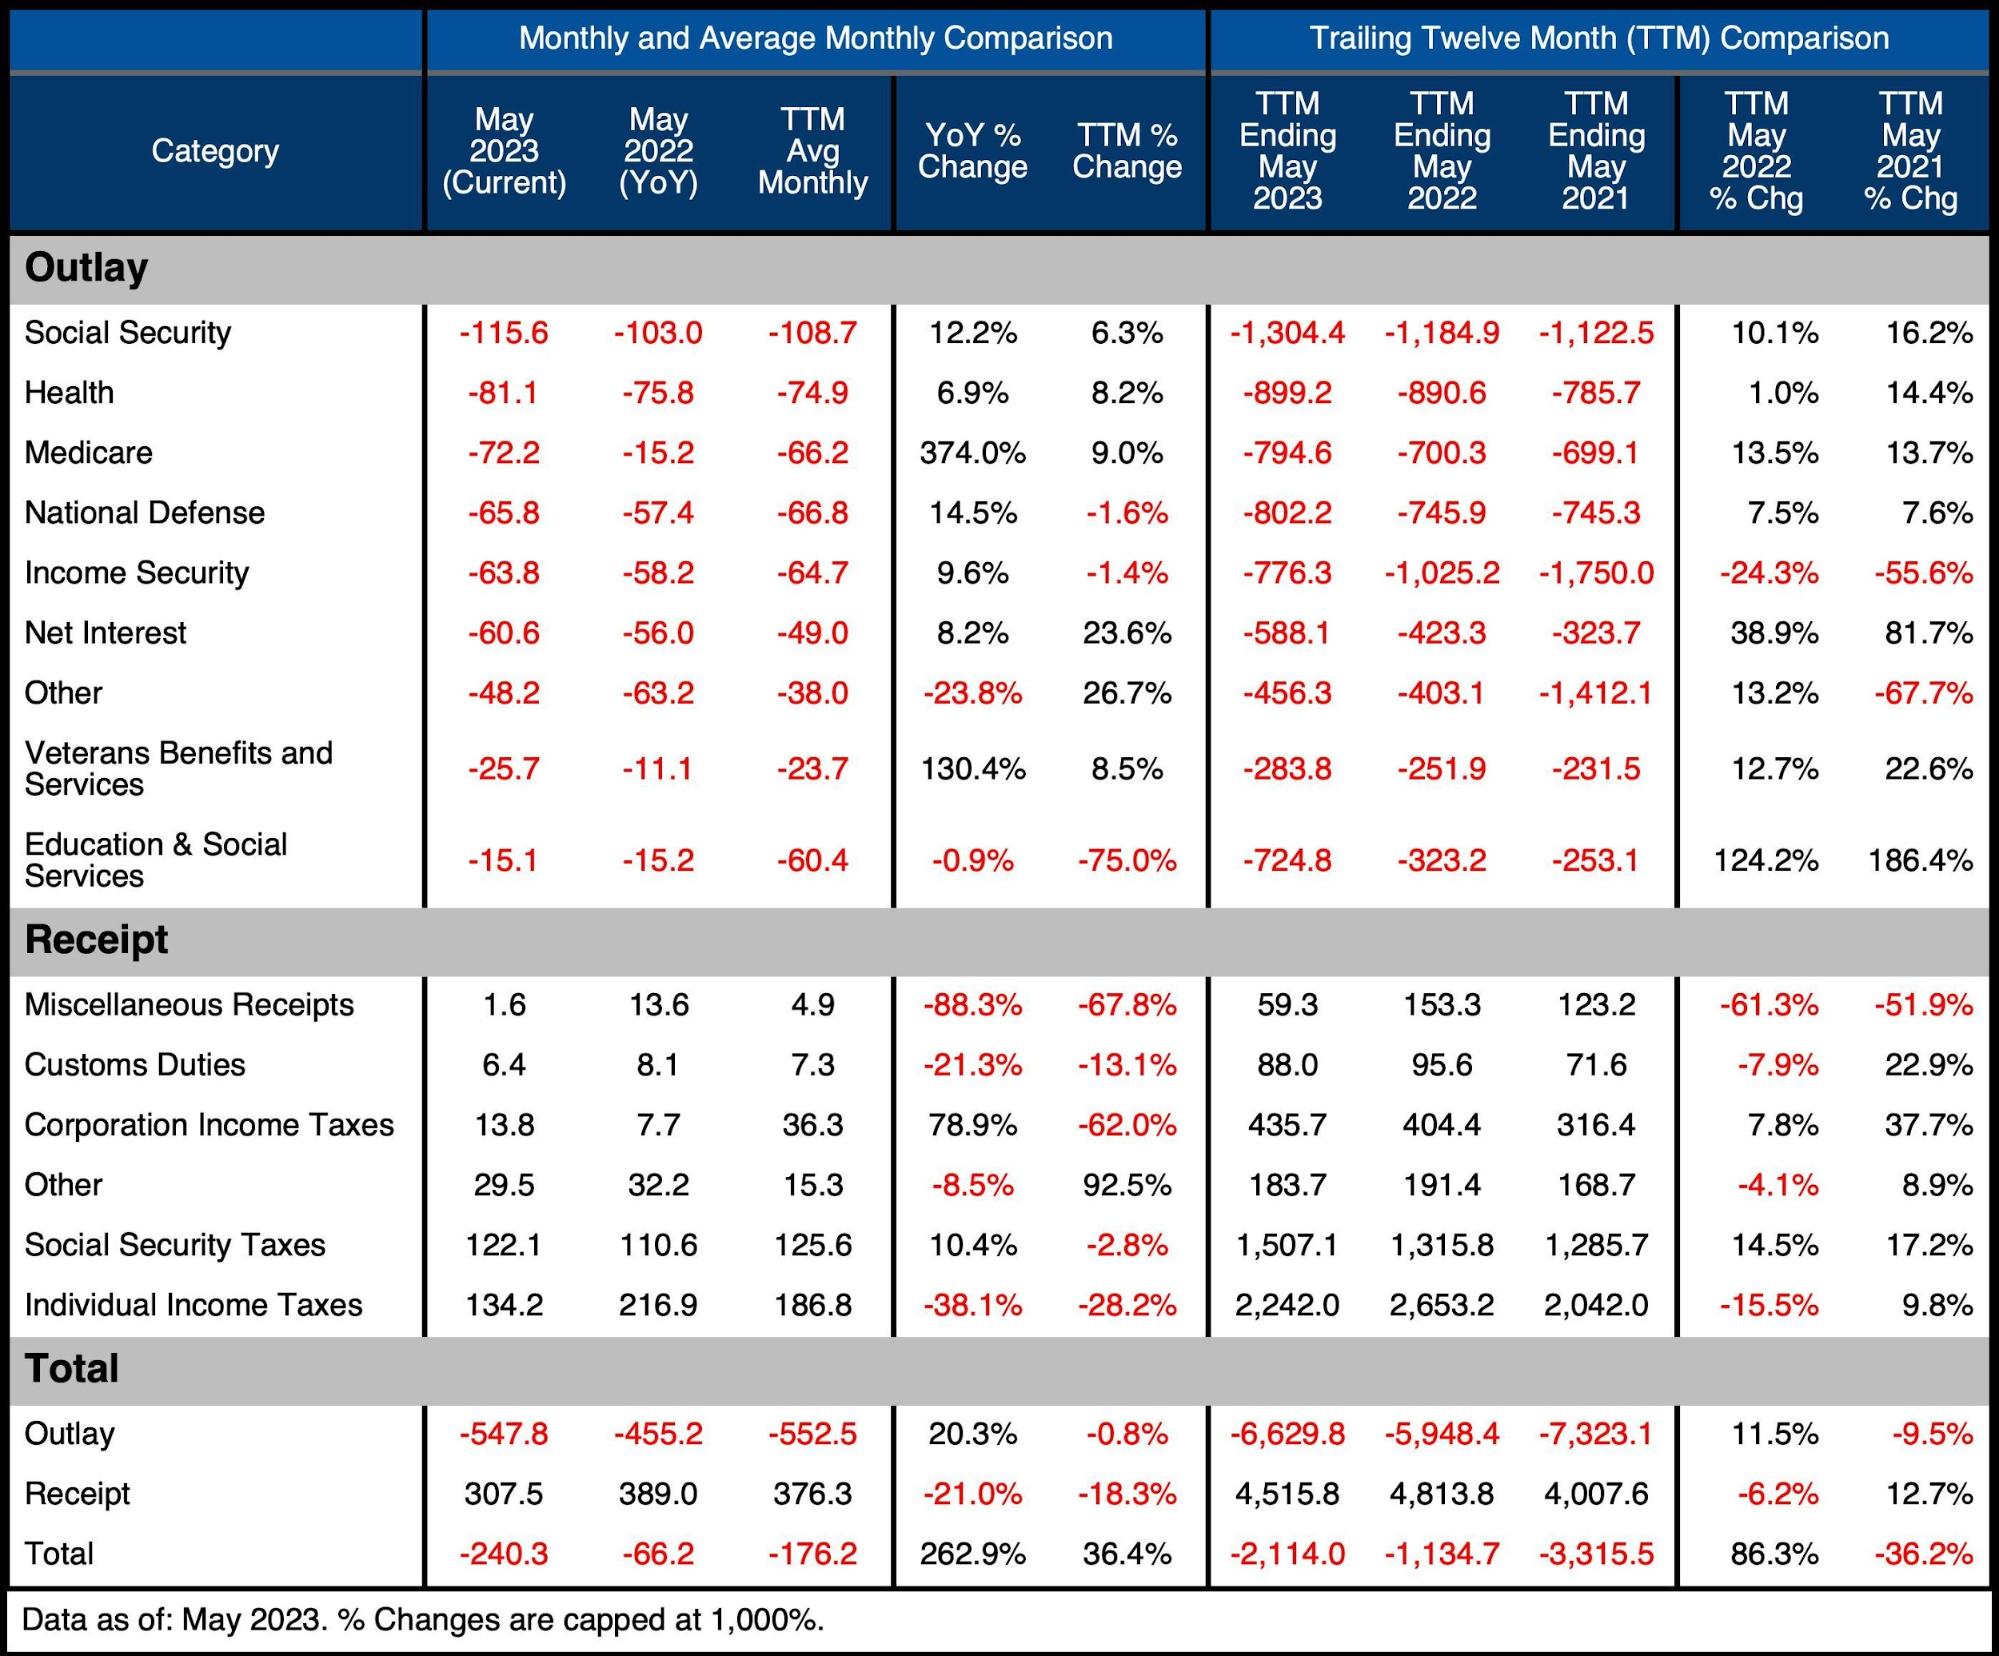
Figure: 9 US Budget Detail
Historical Perspective
Zooming out and looking over the history of the budget back to 1980 shows a complete picture. Both spending and revenue saw a big jump right at the beginning of Covid. Spending saw a retrenchment but has since reversed and started growing again. On the other side, revenue was flat for months but has been dropping in recent months. This means that the recent tax windfalls that helped buffer the increase in spending have now waned as evidenced by the $2.1T TTM deficit.