

by Peter Schiff, Schiff Gold:

The chart below shows the gimmicks the Treasury has been using to manage the debt while the debt ceiling keeps a lid on new issuance. The primary gimmick used is pillaging government retirement funds which hold non-Marketable debt. In April, the government replenished some of what has been taken by retiring public debt (mostly short-term) as tax receipts increased cash available to the Treasury. They will most likely tap back into this next month as the government gets closer to running out of money.
TRUTH LIVES on at https://sgtreport.tv/
Note: Non-Marketable consists almost entirely of debt the government owes to itself (e.g., debt owed to Social Security or public retirement)
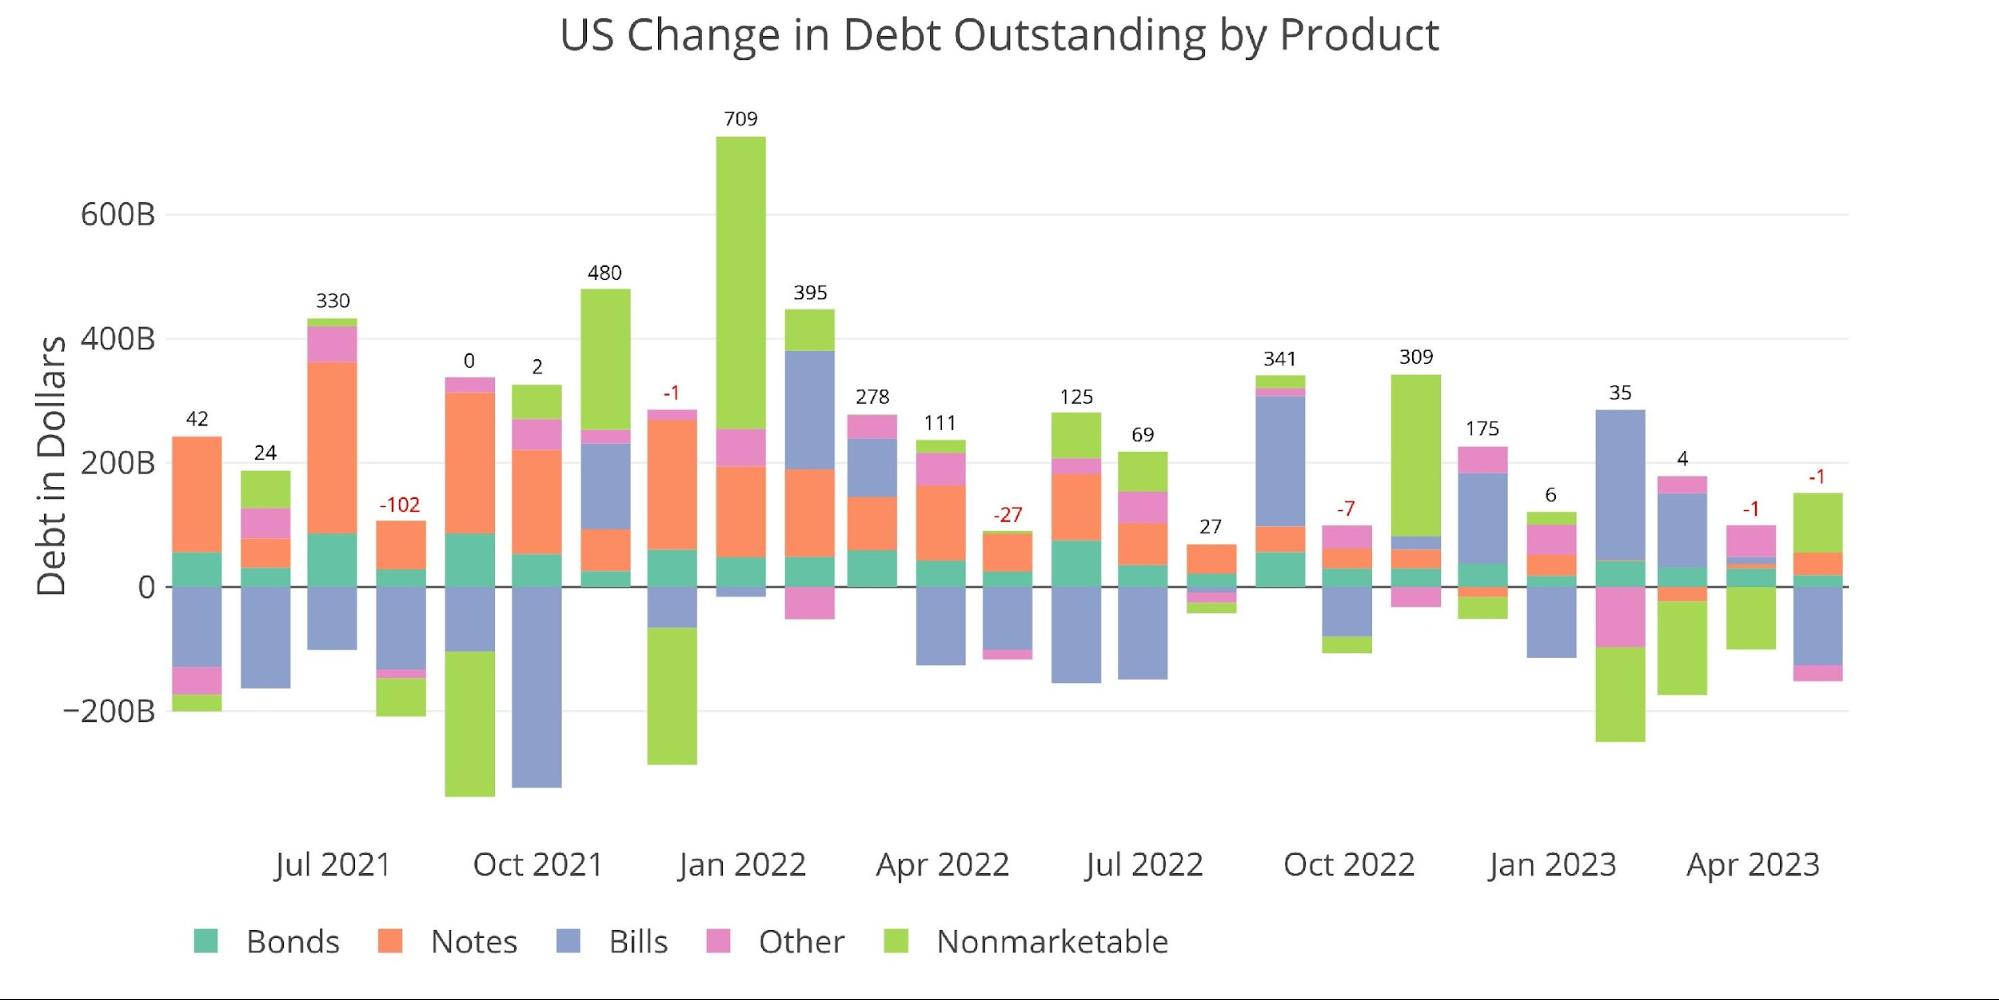
Figure: 1 Month Over Month change in Debt
Given the current debt ceiling saga, the total debt add for the current calendar year does not amount to anything material. The only thing to really notice is that the government replaces Non-Marketable debt with short-term debt.
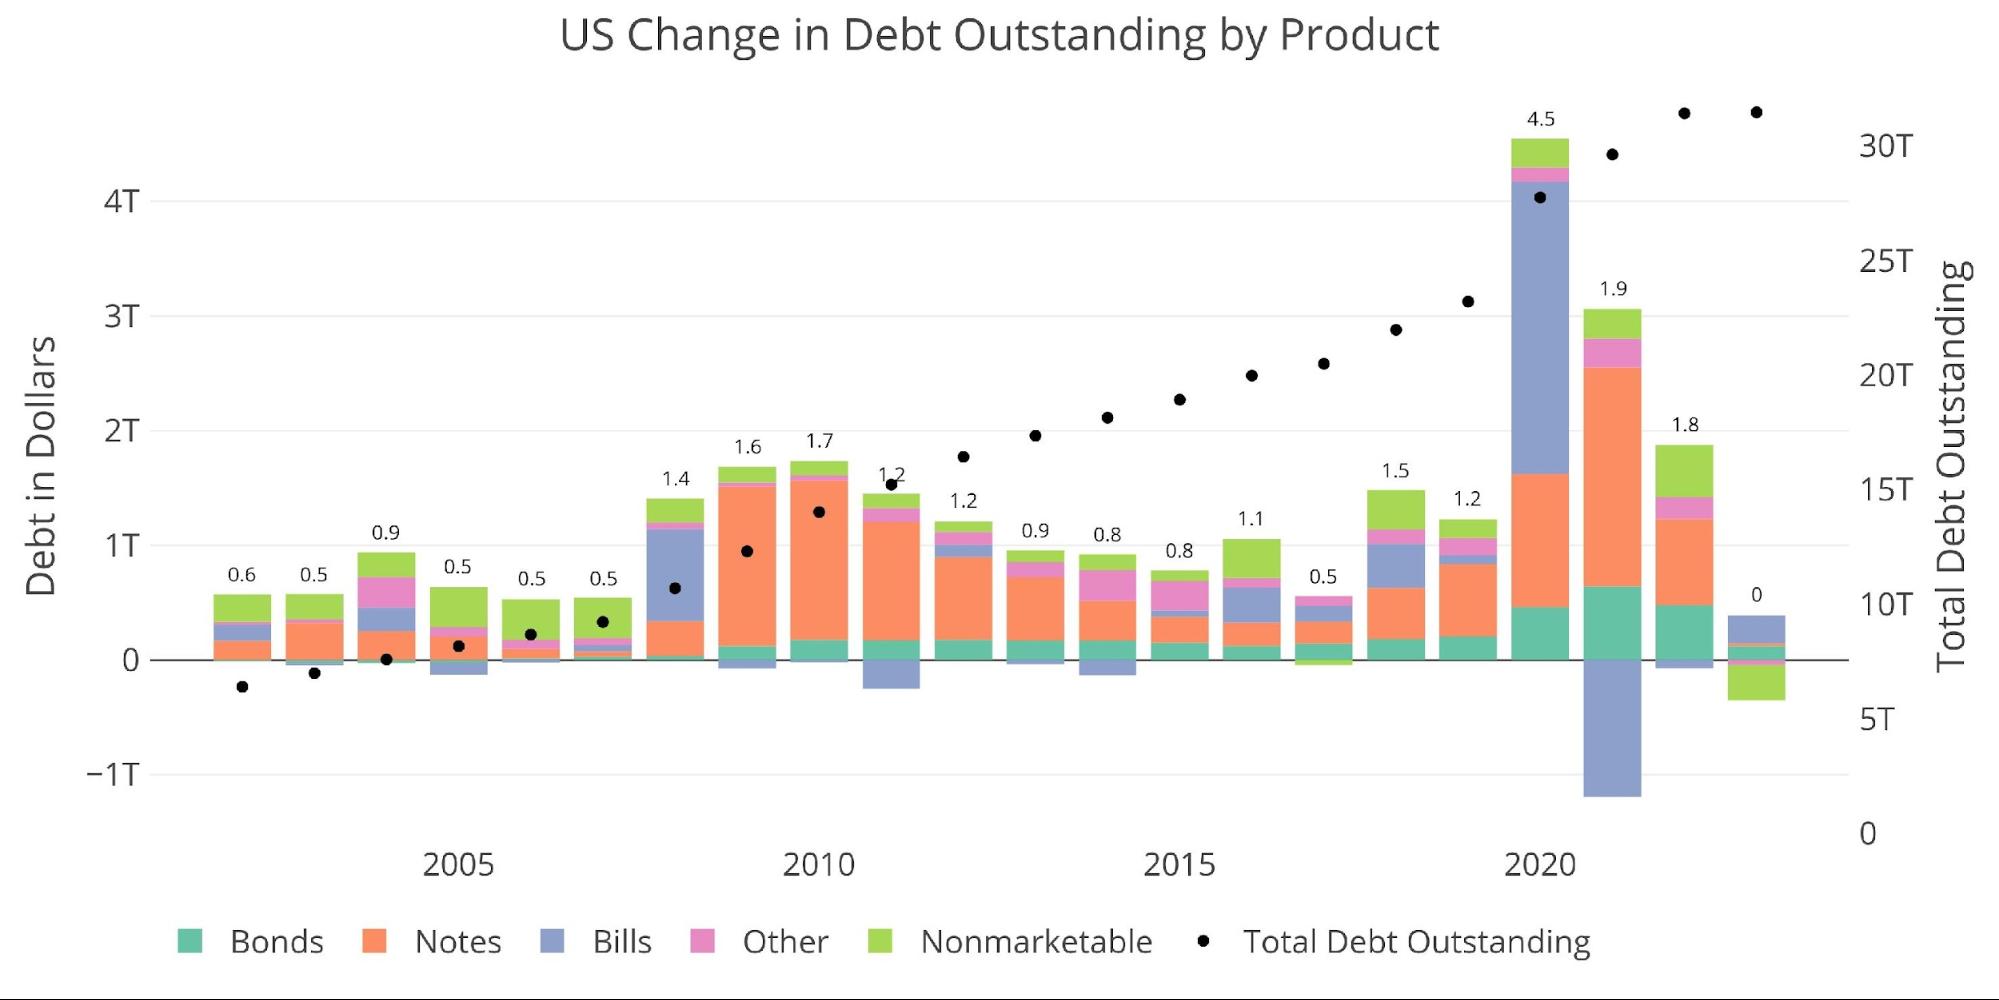
Figure: 2 Year Over Year change in Debt
Before the April tax receipt surge, Treasury cash balances had gotten as low as $86B on April 13th. Receipts then brought the cash balance up to $316B on April 26th. As of May 4th, that balance has already fallen back to $188B.
Unfortunately for the Treasury, tax receipts are much lower than forecast. This has an immediate impact of giving the Treasury a shorter runway before the debt ceiling must be raised while also increasing budget deficits to much larger levels than previously expected.
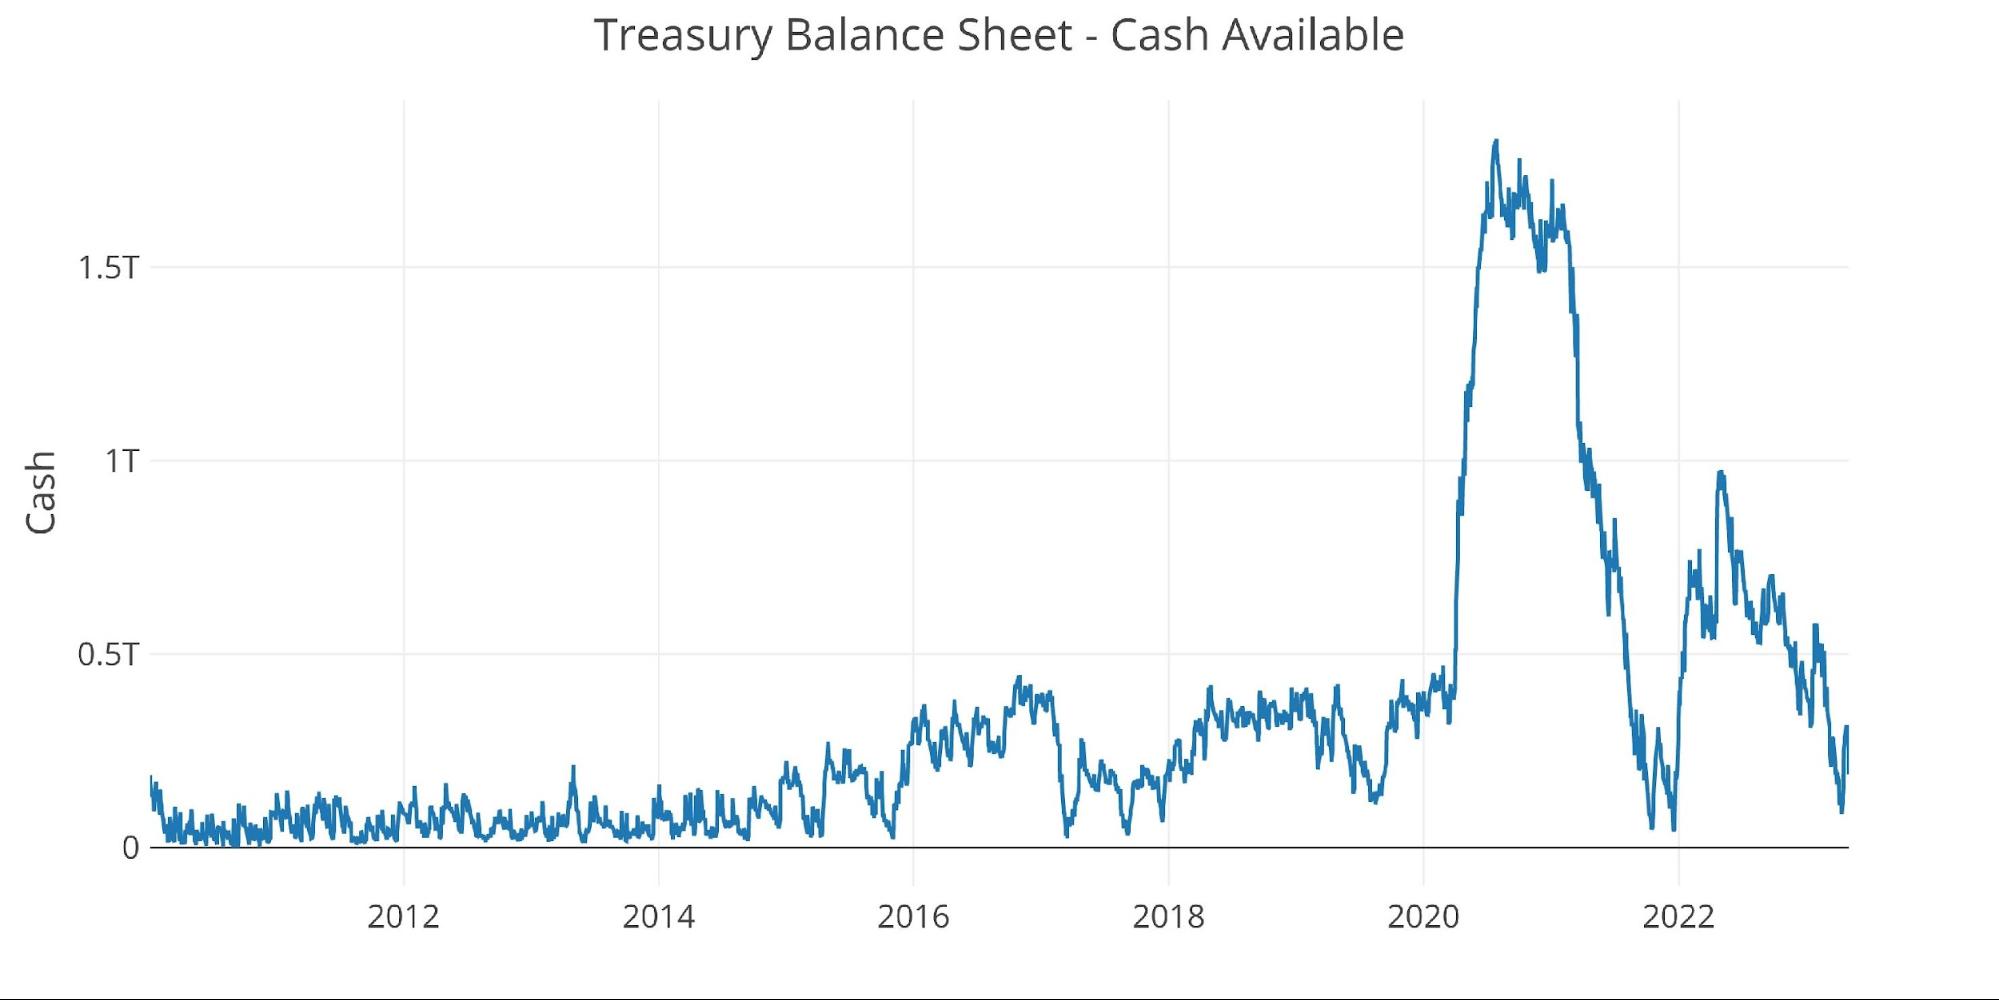
Figure: 3 Treasury Cash Balance
Average maturity on the debt has fallen some as the Treasury has been issuing mostly short-term debt since the debt ceiling was hit. That said, it still stands at 6.17 yrs. which is near multi-decade highs.
Weighted average interest has reached 2.28%. This is only back to 2019 levels; however, a significantly higher debt balance means that interest expense is far greater than it was back then.
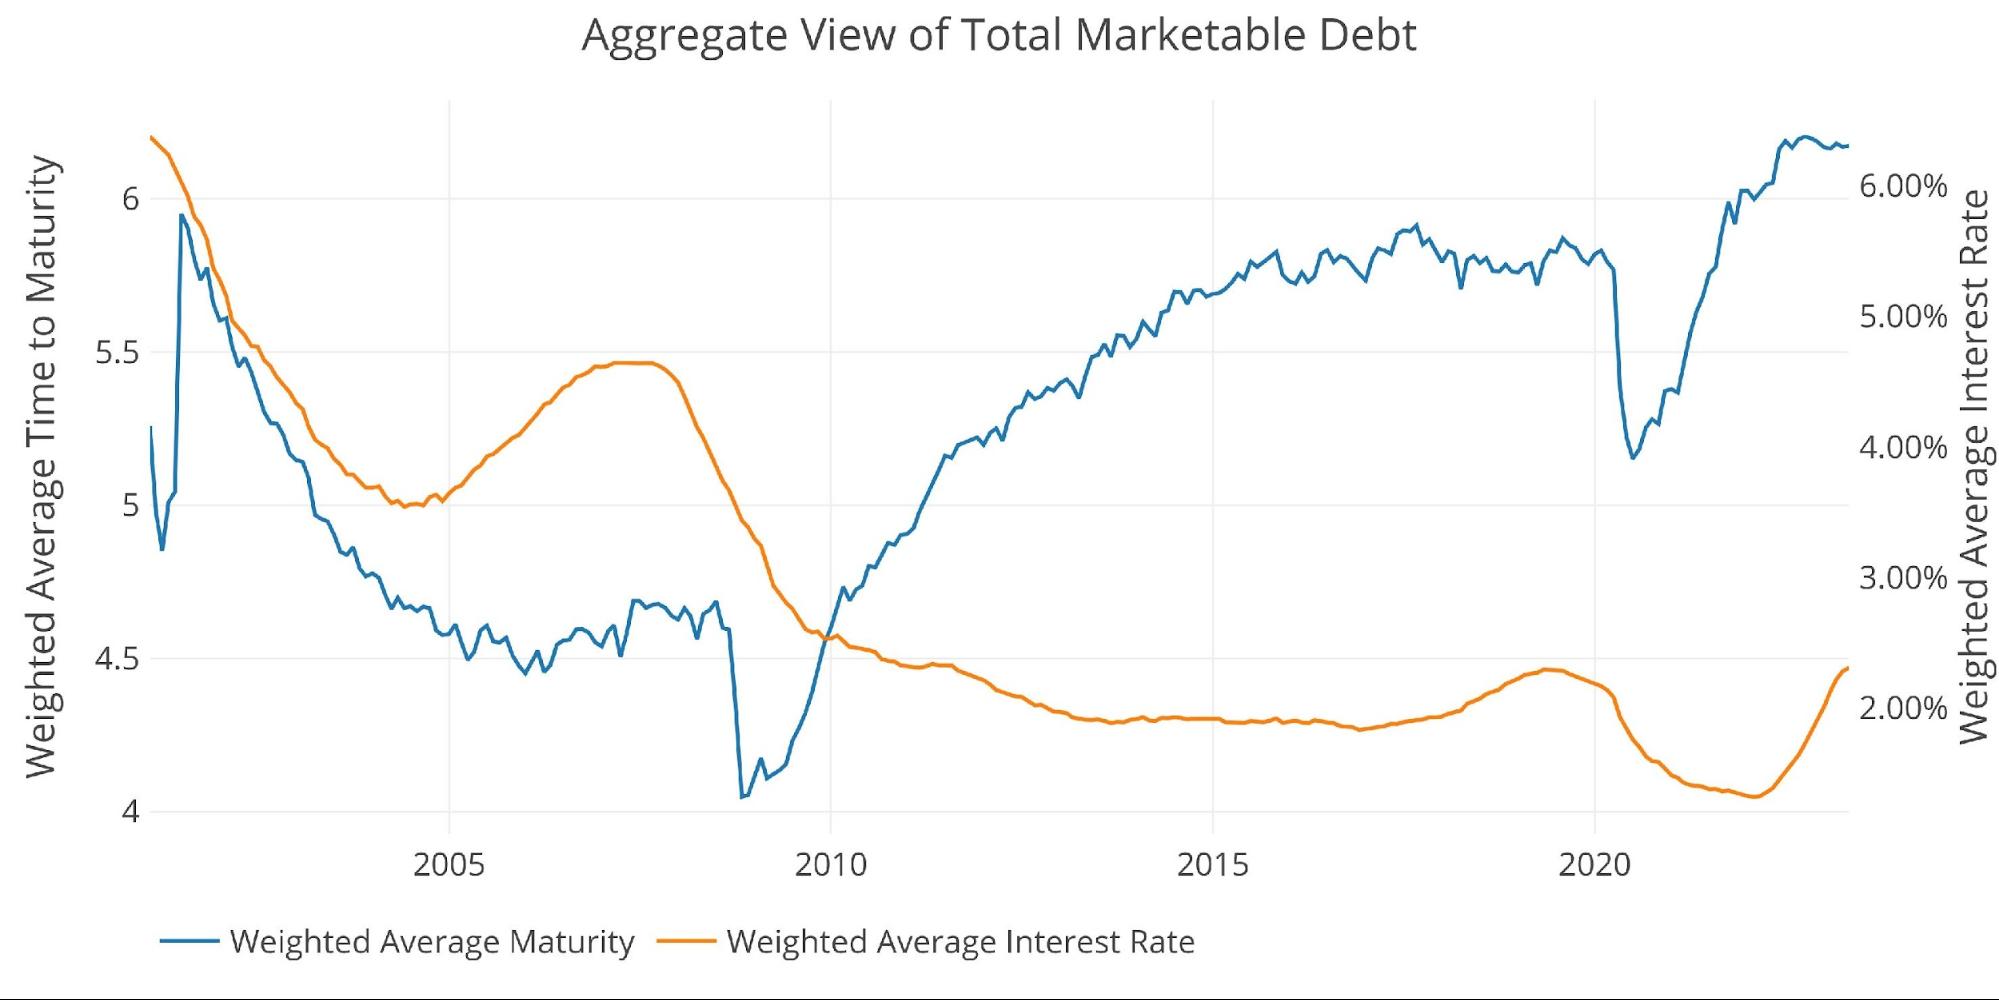
Figure: 4 Weighted Averages
This can be seen clearly in the chart below. Interest expense has absolutely exploded upwards. In 2019, interest expense reached about $350B. Despite a similar weighted average maturity, interest expense is now $564B!
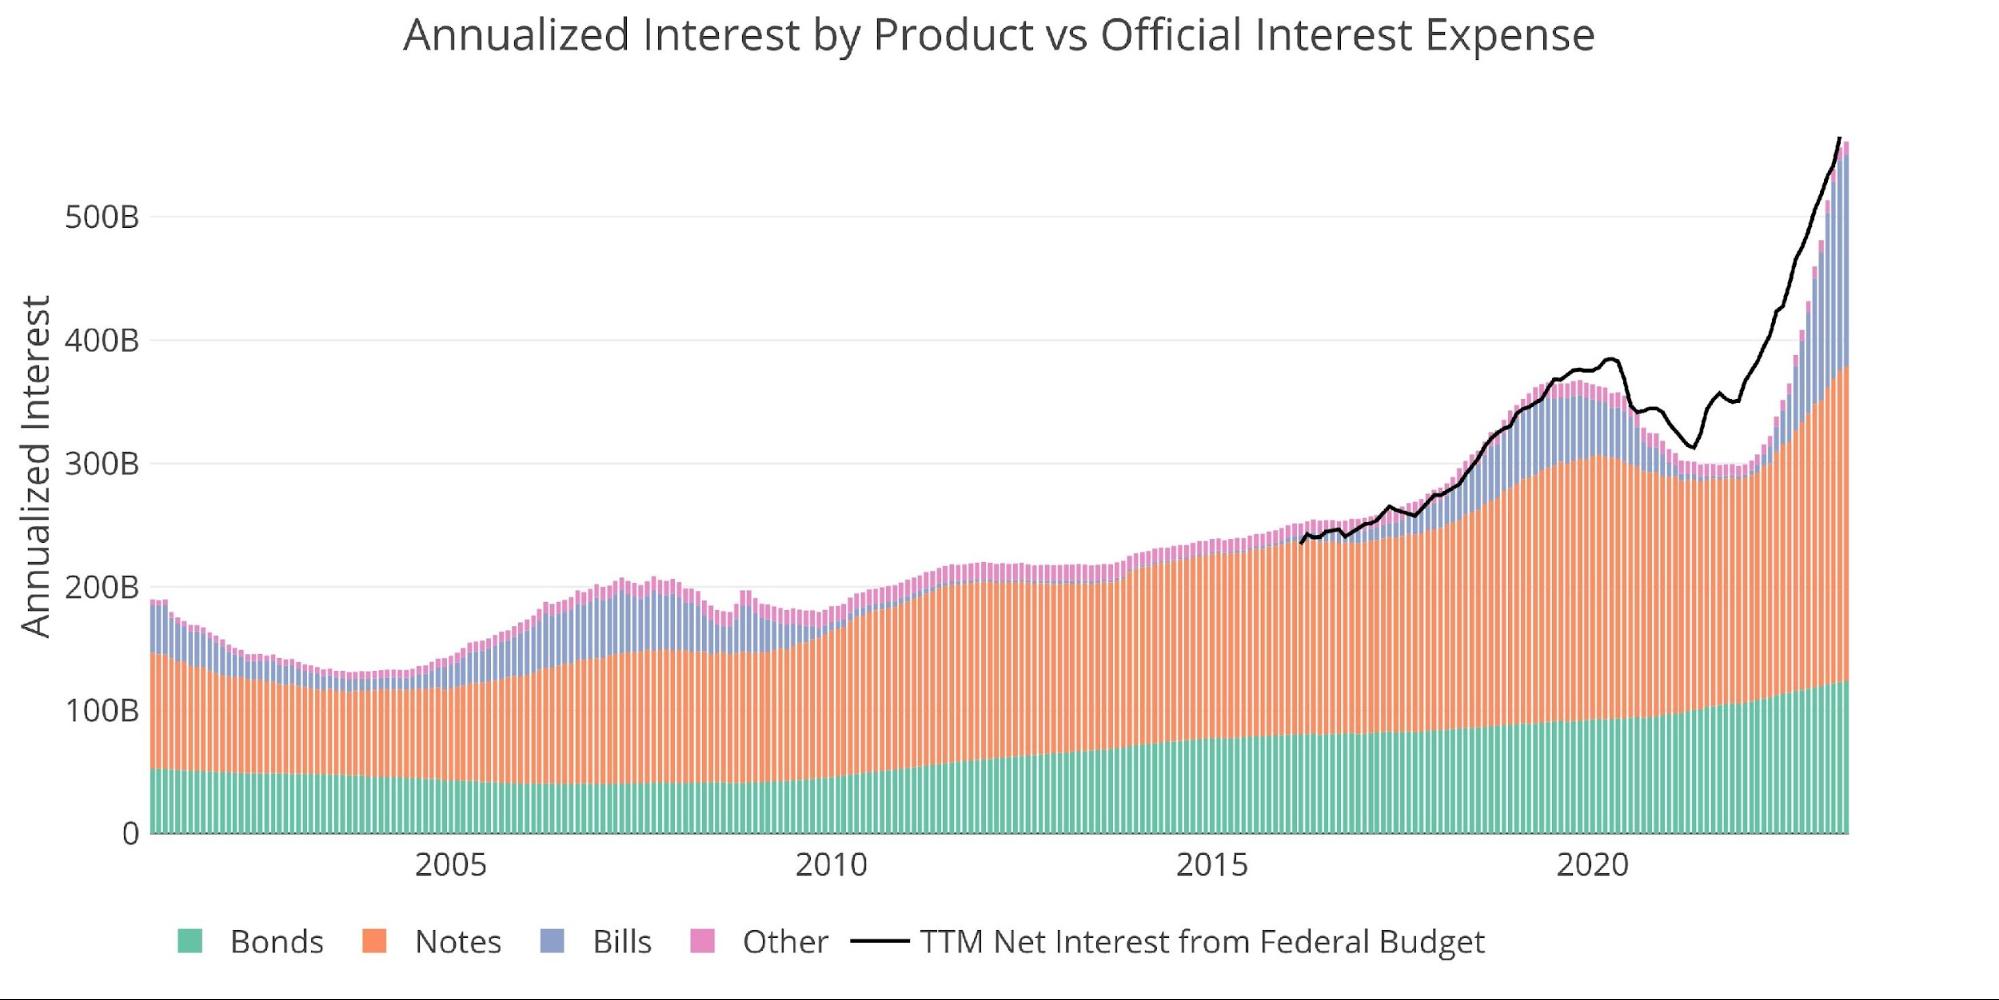
Figure: 5 Net Interest Expense
As bad as a 61% increase in Net Interest Expense seems, the more troubling part is the trajectory. The plot below uses the debt maturity schedule and an anticipated $2T a year in new debt issuance to forecast interest expense based on Fed rate expectations. By the end of this year, the Treasury will face Interest Expense exceeding $700B annually, crossing $800B by next June!
This is the reason the Fed cannot keep rates elevated for long. This is not something that happens over several years. The impact of higher rates is happening right now and will worsen dramatically over 12 months.
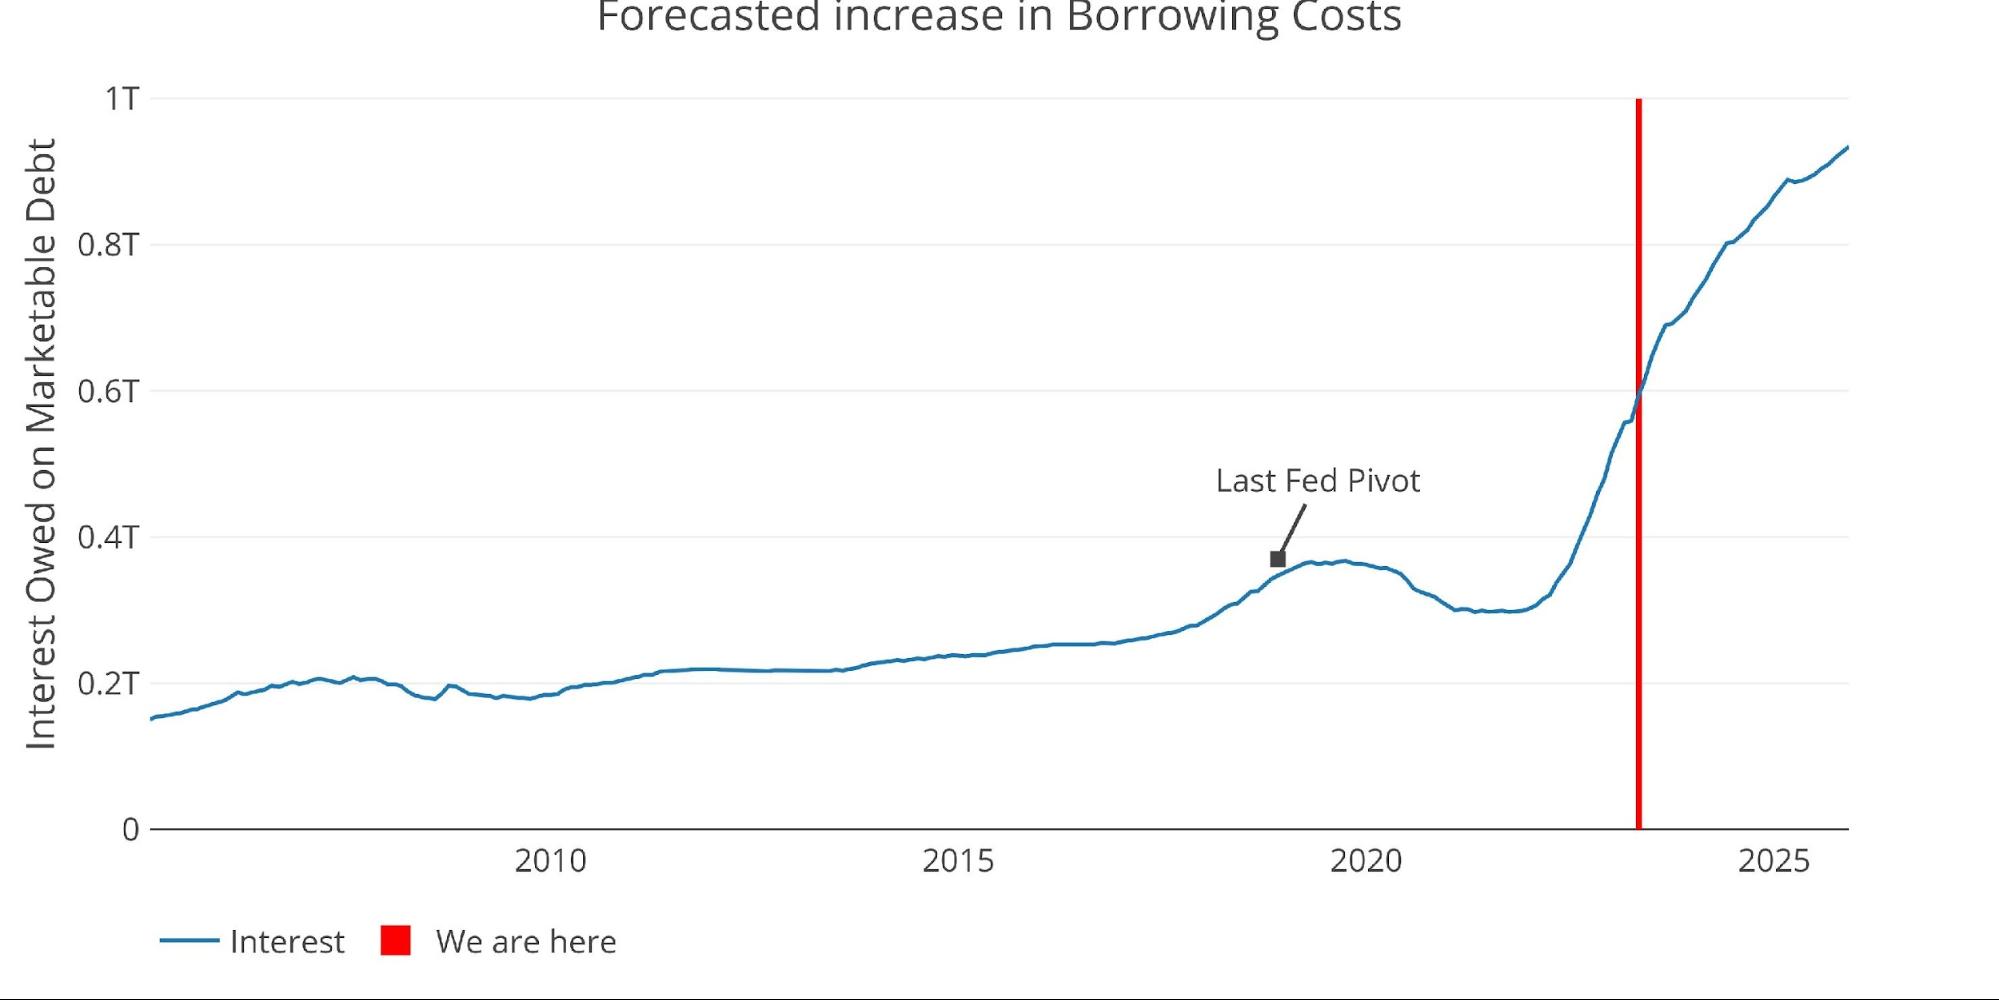
Figure: 6 Projected Net Interest Expense
The rollover of the debt can be seen below. Most of the near-term rollover will be Bills that will be close to the higher rates already. It will be the Notes rolling over that will really drive interest costs.