

by Steve Kirsch, Steve Kirsch’s newsletter:
 Confirmed: vaccines are a public health disaster because they are the #1 cause of chronic disease. When will the medical community admit their error?
Executive summary
But not all. I recently got an email from a college professor of mathematics who decided to do a more detailed analysis to see if my recent survey was accurately reflecting reality.
TRUTH LIVES on at https://sgtreport.tv/
His conclusion: Yes, the survey results are very convincing and we have a very serious problem. The survey results which implicate the vaccines as the primary cause of chronic disease cannot be “explained away” as “biased” or “confounded.”
This is likely why I was unable to get a qualified epidemiologist, statistician, data scientist, or mathematician to challenge me on my results in a public forum.
The whole vaccine schedule is a healthcare disaster and nobody wants to talk about it.
The survey data
This article describes the survey and my conclusions.
Switkay’s analysis
Professor Hal Switkay’s analysis can be downloaded here (clicking the link will download the excel spreadsheet).
Summary of the approach used by Professor Switkay
In my initial analysis of the survey data, I looked at the odds at the extreme points (no vax vs. fully vaxxed) to compute an odds ratio.
What Professor Switkay did was to look at all the intermediate data points in the survey and check for a dose-response relationship that would be consistent with a causality hypothesis.
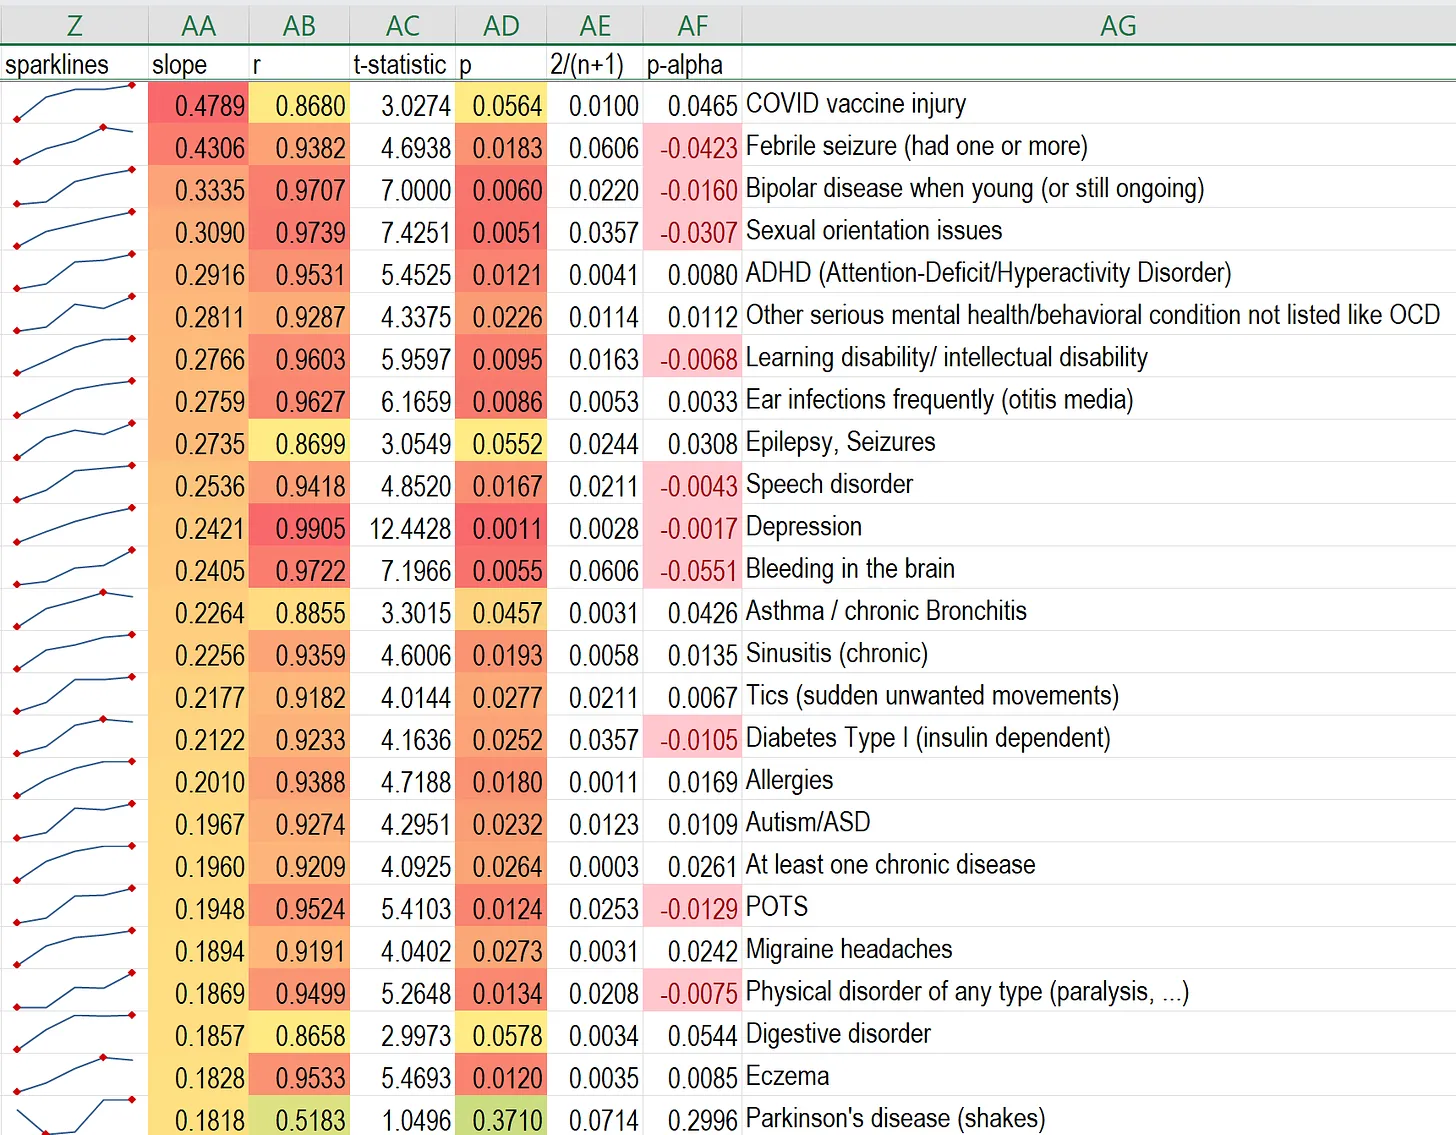
So instead of looking at two data points per condition (the odds for unvaxxed and vaxxed), he looked at all 5 data points (since there were 5 different vax levels in the survey: no, low, medium, high, very high) and then fit a line through them.
For each condition, he did a regression analysis on the log of the odds and computed the value for the Pearson correlation coefficient (aka “r”), t statistic, slope of the line through the points (an indicator of the effect size), and more.
If vaccines are causing a condition in a linear fashion, plotting the log odds should be a straight line. In short, if the log of the odds is a straight line, it means that if you double the dose, you double the response.
Read More @ kirschsubstack.com

