

by Pam Martens and Russ Martens, Wall St On Parade:
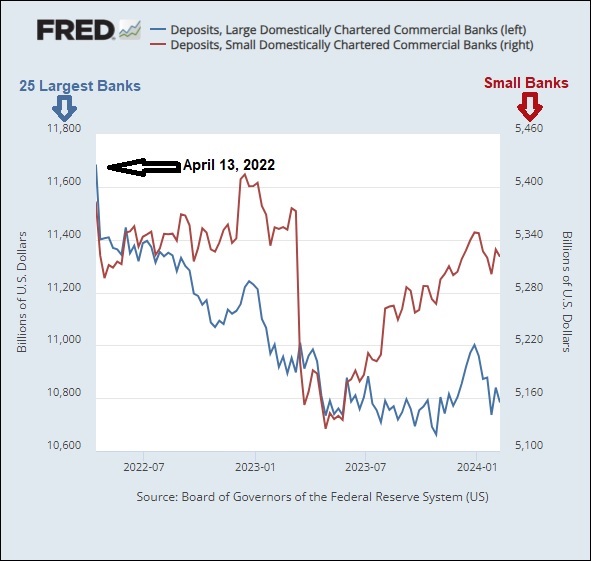
According to Federal Reserve data dating back to July 3, 1985 – a span of close to 39 years – there has not been a time when the largest 25 banks were bleeding deposits on the scale that has been happening for the past 22 months.
There has also never been a time comparable to the last 22 months when the largest 25 banks were bleeding deposits while the smaller banks were growing deposits. (See the chart above.)
TRUTH LIVES on at https://sgtreport.tv/
To get our minds around today’s situation, we made another chart using Federal Reserve data dating back to 1998 – the year before the Glass-Steagall Act was repealed. It shows that the ratio of deposits of the 25 largest banks to the smaller banks stood at 3 times in 1998 and has shrunk to its lowest level of 2.03 times as of February 7 of this year.
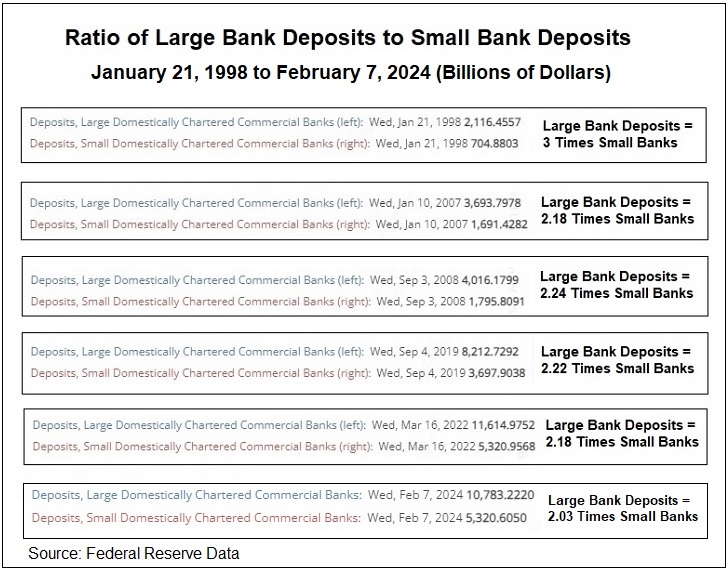
That ratio has shrunk even though the Fed has allowed big banks to gobble up smaller banks at a mind-boggling rate. (See our report: In 16 Years, the Fed Has Approved 4,506 Bank Mergers and Denied One.)
The repeal of the Glass-Steagall Act in 1999 allowed the giant trading houses on Wall Street to merge with giant, federally-insured, taxpayer backstopped commercial banks, creating the Frakenbanks that blew themselves up in 2008, taking the U.S. economy on the worst ride since the Great Depression of the 1930s.
To give you an idea of how radically the Fed’s thinking on its emergency lending facilities has changed since the financial crisis of the 1930s, during the Great Depression the Fed made just 123 emergency loans totaling $1.5 million – approximately $33.77 million in today’s dollars.
During the 2007 to 2010 financial crisis, the Fed made more than $16 trillion (yes, trillion) in emergency cumulative loans to the casino banks on Wall Street, as well as to foreign banks that were Wall Street’s derivative counterparties, as well as to mega bank trading subsidiaries in London. Then the Fed battled the media in court for years to prevent that $16 trillion figure from becoming public. (See chart below from the Government Accountability Office’s (GAO) audit of the Fed’s emergency lending facilities from 2007 to 2010.) Just one Frankenbank at the time, Citigroup, received $2.5 trillion in secret cumulative loans from the Fed.
To put this in sharper perspective, $16 trillion is 474,777 times the amount of money the Fed loaned during the Great Depression, using the $33.77 million adjusted figure. Does that mean that the Wall Street mega banks are 475,000 times more dangerous today than they were in the 1930s?
It might very well mean that, for this reason: From the passage of the Glass-Steagall Act in 1933 to its repeal in 1999 under the Wall Street-cozy Bill Clinton administration, there were no major threats to the U.S. banking system that required the need for emergency lending by the Fed under Section 13(3) of the Federal Reserve Act. But just 9 years after the repeal of Glass-Steagall, the Fed went on a wild emergency lending spree and century-old iconic banks on Wall Street blew up.
Read More @ WallStOnParade.com