

by Jim Rickards, Daily Reckoning:
continually remind gold investors, whether in bullion or mining shares, not to get too euphoric when gold rallies and not to get too depressed when the dollar price retreats. Gold is still the best form of money and proves valuable to investors over time. This is true whether inflation or deflation prevails.
The key for investors is to stay focused on the long-term attributes of gold and not get caught up in day-to-day price moves. The dollar price of gold is volatile. For example, gold’s down over $17 today. But that’s not significant.
There’s no reason why your investment outlook needs to be volatile too.
TRUTH LIVES on at https://sgtreport.tv/
That said, it’s worth looking at the long-term prospects for the dollar price of gold. If we’re not going to sweat the short run, we should care about the long run.
I have frequently forecast that gold will reach $15,000 per ounce by 2026 or sooner. That’s not a guess; it’s the result of rigorous analysis.
There’s never a guarantee that a particular outcome will prevail, but this gold price forecast is based on the best available tools and models that have proved accurate in many other contexts.
This is a good time to explain exactly how that $15,000 price forecast emerges.
Lessons From Two Prior Bull Markets
For a technical model, we turn to the two prior bull markets in gold and compare those to the performance of the current bull market.
The first bull market in gold ran from August 1971 to January 1980. The dollar price of gold rallied from $35 per ounce to $800 per ounce. That’s a 2,200% gain in 9.4 years.
The second bull market in gold ran from August 1999 to August 2011. The dollar price of gold rallied from $250 per ounce to $1,900 per ounce. That’s a 670% gain in 12 years.
Of course, the period after 1980 was a long bear market that lasted 19 years and saw the dollar price of gold drop 68%. The period from August 2011 to December 2015 was another bear market lasting 4.3 years that saw the dollar price of gold drop 45%.
I’m not ignoring those. It’s simply the case that we’re in a new gold bull market now, so prior bull market behavior is the right reference frame for predictive analytics.
Another question is why do I begin my bull/bear market analysis in 1971? Gold has been money throughout the history of civilization and has been minted in the form of gold coins since at least the sixth century BC.
The answer is that prior to 1971 either gold was money (in which case there is no other “money” to compare it to; gold was valued by weight, not exchange rates), or the world was on a gold standard in which the money price of gold was fixed (albeit with suspensions of convertibility during wars and periodic breaks due to devaluations).
In a world in which gold is money’s or gold’s value is fixed by law, there are no bull or bear markets, although there can be inflation or deflation.
The Third Bull Market
The third bull market in gold began on Dec. 16, 2015, with gold hitting a bottom of $1,050 per ounce at the end of the prior bear market. Since then, gold has rallied to about $2,000 per ounce as of today, a 90% gain.
If we take a simple average of the price gains and durations of the two prior bull markets in gold, we arrive at a 1,435% gain over a period of 10.7 years.
Applying that gain and duration to a baseline of $1,050 per ounce beginning in December 2015 leads to a gains projection for this bull market of $15,070 per ounce by August 2026.
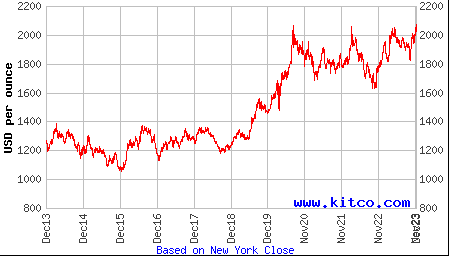
Source: Kitco.com
There’s nothing deterministic about this model. Actual gains could run ahead of this projection both in time and by amount. Conversely, the bull market could end at any time for a wide variety of reasons.
The prior bull market gains could be annualized to produce a slightly lower average gain per year. Still, the bull market assumptions are moderate since we’ve taken a simple average and not stretched for the higher gain or the shorter duration of the two.
Again, using the history of gold bull markets as a guide, a dollar price of gold of $15,000 per ounce in the next three years is not a stretch.
The Road to $15,000
Finally, a bit of elementary math is helpful in understanding how the dollar price of gold can move to $15,000 per ounce in the next three years. For this purpose, we’ll assume a baseline price of $2,000 per ounce, essentially where gold is today.
A move from $2,000 per ounce to $3,000 per ounce is a heavy lift. That’s a 50% increase and could easily take a year or more. Beyond that, a further increase from $3,000 per ounce to $4,000 per ounce is a 33% increase, another large rally. A further gain from $4,000 per ounce to $5,000 per ounce is a further gain of 25%.
But notice the pattern. Each gain is $1,000 per ounce, but the percentage increase drops from 50% to 33% to 25%. That’s because the starting point is higher while the $1,000 gain is constant. Each $1,000 jump represents a smaller (and easier) percentage gain than the one before.
This pattern continues. Moving from $9,000 per ounce to $10,000 per ounce is only an 11% gain. Moving from $14,000 per ounce to $15,000 per ounce is only a 7% gain. Gold can move 1% in a single trading day, sometimes 2% or more.
Read More @ DailyReckoning.com