

by Pam Martens and Russ Martens, Wall St On Parade:
On March 17, 2022, the Federal Reserve began its interest rate hiking cycle, which has, thus far, evolved into 10 consecutive rate hikes, making it the fastest rate increases in 40 years. The Fed’s actions to tame inflation included four consecutive interest rate hikes of an aggressive 75 basis point hike (three quarters of one percent) on June 16, July 28, September 22, and November 3 of last year.
At that point, every trading veteran on Wall Street was scratching their head and asking themselves the same question: why aren’t we hearing about interest rate derivatives blowing up and taking down either a U.S. mega bank or its counterparty on the wrong side of the trade?
TRUTH LIVES on at https://sgtreport.tv/
According to the quarterly derivative reports released by the Office of the Comptroller of the Currency (OCC), the regulator of national banks, as of December 31, 2021, four mega commercial banks held $118 trillion notional (face amount) of interest rate derivatives. That $118 trillion represented an astounding 91percent of all interest rate derivatives held by all commercial banks in the United States.
Those four banks and their interest rate derivatives as of December 31, 2021 are as follows: JPMorgan Chase Bank, $45.47 trillion in interest rate derivatives; Goldman Sachs Bank USA with $34.24 trillion; Citigroup’s Citibank N.A. with $25.88 trillion; and Bank of America N.A. with $12.58 trillion.
But here is where things really get interesting. (See Table 20 on page 25 of the OCC report.) As of December 31, 2021 – prior to the March 17, 2022 launch of the fastest Fed rate hikes in 40 years, those same four banks were holding a combined $18 trillion notional in interest rate derivative contracts which had a maturity of more than five years. Exactly how does one get out of these contracts, or find a counterparty to hedge them with, once the Fed starts tightening and shows no signs of stopping? Did all four banks have a magical crystal ball and make bets in those 5+year contracts that interest rates would be skyrocketing?
Of the four banks named above, Goldman Sachs Bank USA had the largest exposure to interest rate derivative contracts with a maturity of more than five years. Its exposure was $6.7 trillion notional.
Goldman Sachs Bank USA now seems to be in a desperate bid to raise cash, using the Apple brand to seduce customers into a savings account paying a high rate of interest. (See our report: Apple Is Loaning Its Brand to the Great Vampire Squid to Offer FDIC-Insured Savings Accounts.)
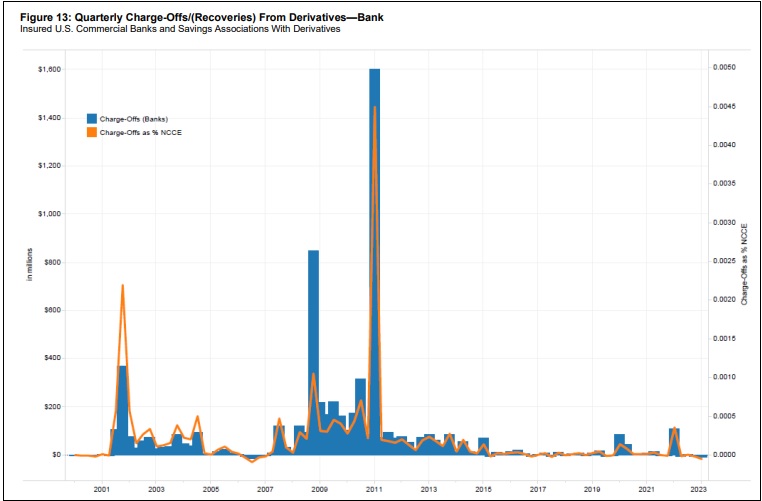
Adding to our curiosity as to how everybody landed on the correct side of the interest rate derivative trades during the fastest rate hikes in 40 years, is a chart in the most recent OCC derivatives report for the first quarter of this year. It shows how much commercial banks have charged off quarterly for derivative losses since 2000. Following the financial crisis of 2008, the charge-offs spiked to as high as $1.6 billion in 2011 but have been absolutely tame in the past two years. How is this possible? (See chart below from the OCC’s current report.)
Earlier this week, we emailed the very nice and responsive folks in the press office of the OCC with two questions on the current OCC report on derivatives for the quarter ending March 31, 2023. The first question inquired about the following:
“Regarding Table 16 in the current report, where does the OCC get the data for the column titled ‘Bilaterally netted current credit exposure’? That is, does the OCC calculate it or does the OCC rely on the respective bank to calculate it and provide it to the OCC?”
An OCC spokesperson responded as follows:
“Bilaterally netted current credit exposures shown in Table 16 are calculated and reported by each respective bank. This information is reported on Call Report Schedule RC-R Part II, Risk-Weighted Assets, Memorandum Item #1 ‘Current credit exposure across all derivative contracts covered by the regulatory capital rules.’ ”
In other words, banks that have rigged everything from foreign exchange to Libor interest rates, to precious metals, to U.S. treasury securities have the full confidence of the OCC to accurately report their derivative exposures.
Bilateral netting is defined by the OCC as follows:
“A legally enforceable arrangement between a bank and a counterparty that creates a single legal obligation covering all included individual contracts. This arrangement means that a bank’s receivables or payables, in the event of the default or insolvency of one of the parties, would be the net sum of all positive and negative fair values of contracts included in the bilateral netting arrangement.”
According to Table 16 in the current OCC report, through the use of bilateral netting, those four mega banks mentioned above have reduced their total derivative contracts (interest rate, credit, equities, precious metals, foreign exchange, etc.) for the purpose of calculating total credit exposure to capital, as follows: JPMorgan Chase Bank’s total derivatives went from $59.8 trillion to $317.4 billion. Goldman Sachs Bank USA’s total derivatives went from $56.5 trillion to $76.34 billion – making JPMorgan Chase look like an amateur at bilateral netting. Citibank’s total derivatives went from $55 trillion to $181 billion; and Bank of America’s total derivatives dived from $22 trillion to a very tame $100 billion. (See chart below derived from Table 16 data on page 20 of the current OCC report.)
Read More @ WallStOnParade.com