

by William Makis, MD, Covid Intel:
Pilots have been suffering from COVID-19 mRNA vaccine injuries. Pilot incapacitations and cardiac arrests are on the rise – the question is, how does the data look historically? This excellent substack article takes a deep dive. –
Pilot Incapacitation Events seem to have been receiving extra attention. We at US Freedom Flyers have been collaborating with Dr Makis on Pilot Incapacitation Event data (Covid Intel). Each event is news and noteworthy, but is the number of Pilot Incapacitation Events in 2023 actually on track to exceed historical averages? While we certainly hope this is not the case, the current data should be examined against the available statistics. To provide this context, we can turn to some prior studies conducted by the FAA.
TRUTH LIVES on at https://sgtreport.tv/
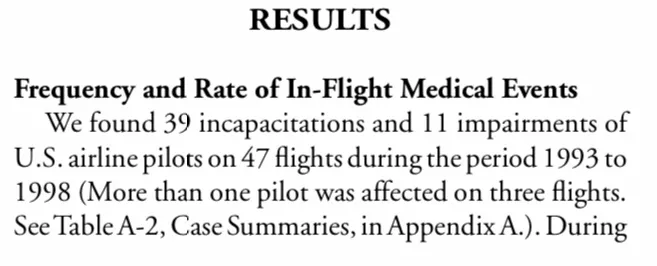
One such study published by the Office of Aerospace Medicine in October of 2004 was named ‘In-Flight Medical Incapacitation and Impairment of U.S. Airline Pilots: 1993-1998. ( https://libraryonline.erau.edu/online-full-text/faa-aviation-medicine-reports/AM04-16.pdf )
The Results section on pages 3-4 state that there were 39 pilot incapacitations and 11 pilot impairments on 47 flights over approximately 85,732,000 revenue hours of airline flight operations. If we combine both categories, we find that there are 0.58 events per one million revenue hours. (47/85,732,000 * 1,000,000)

More current studies from the Office of Aerospace Medicine show a similar statistic of 0.61 events per one million revenue hours. This can be found on pages A2-A3 of the link below:

If we examine cardiac incapacitations only from 1993-1998, we can see that on page 5 there are only 5 cardiac events out of the total of 47. This breaks down to .058 events per one million revenue flight hours. (5/85,732,000 * 1,000,000) . Another way to look at cardiac incapacitation events is that they comprise 13% of all incapacitation and impairment events. ( 5/47=.13 )

If we look for cardiac events from 1993-2015 in the second linked study, the percentage is 11% ( page A3 shown above )
The Bureau of Transportation Statistics has data for total airline revenue hours, and also by category such as domestic, international. There are further subdivisions that show revenue hours by type of operator ( major, national, regional)
( https://www.bts.gov/content/air-carrier-profile )

If we look at the 2018 and 2019 total domestic revenue hours, we can see there is an average of 15,199,682 revenue hours. Currently I cannot find a revenue hour statistic for 2022, however by comparing domestic revenue miles of 2022 vs 2018-2019, we can see that 2022 was at approximately 94% of the previous average. The revenue miles in 2023 are trending higher than 2022, so it appears we are on track to have similar data as 2019. ( https://www.transtats.bts.gov/Data_Elements.aspx?Data=7 )


If we then assume that domestic revenue hours in 2023 will be approximately equal to the 2018-2019 rounded average of 15,200,000, and if the total pilot incapacitation and impairment events runs at 0.58-0.61 per 1,000,000 revenue hours, then we could reasonably predict 9-10 events in 2023. (0.6*15.2=9.12), or one event every 40 days.
If the total cardiac events runs at the historic average of 11-13% of all pilot incapacitation events, then we could expect 1 such event per year (9.12*.12=1.09)
Currently, Dr Makis’s substack has a detailed list of all Pilot Incapacitation Events that we are aware of this year. As we are tracking these events in real time, we caution against drawing hard and fast conclusions in either direction. Instead we invite all those who are concerned about this issue to take a few action steps.
Read More @ makismd.substack.com
