

by Wolf Richter, Wolf Street:
![]() Inflation Whac A Mole. Housing Inflation may be peaking at 8%+, but rents re-accelerated.
Inflation Whac A Mole. Housing Inflation may be peaking at 8%+, but rents re-accelerated.
The Consumer Price Index (CPI) for April, released today by the Bureau of Labor Statistics, was marked by a very unwelcome reversal in durable goods prices which suddenly jumped again month-to-month. This was driven by a spike in used vehicle prices. A month ago, we explained why this spike would happen, based on underlying dynamics in prior months and called it a “turning point” in used vehicle prices. Today, it looks like a U-turn.
TRUTH LIVES on at https://sgtreport.tv/
Services inflation remains red hot, but was somewhat moderated by a sharp drop in airline fares, rental cars, and by the infamous and huge adjustment of the health insurance CPI that started in September 2022 and will continue to wreak havoc with services CPI through September 2023.
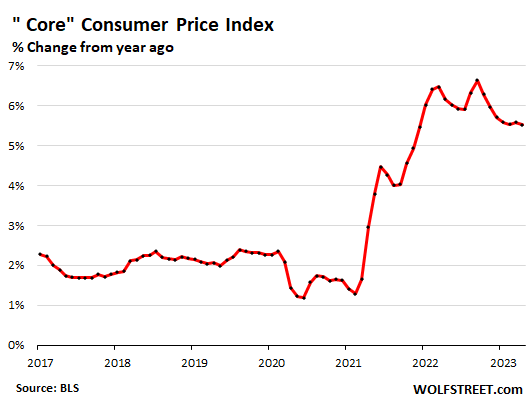
This combination of the month-to-month jump in durable goods and the slight moderation in month-to-month services caused the “core” CPI (overall CPI minus food and energy) to remain stuck for the fifth month in a row at around 5.5% — it’s now higher than overall CPI.
Inflation, once it reaches this level, is a game of Whac A Mole. As you hammer one category down, another one re-pops up.
The huge “base effect” is something we’re going to be talking about here a lot over the next few months because it is now pushing down year-over-year CPI readings through June, but will reverse in July and push them up in July and in the entire second half.
This “base effect” is the result of the surge of CPI last year through June, which forms the base for the year-over-year comparisons now. But last July, the index kinked with a month-to-month negative reading (on a plunge in energy prices and dropping durable goods), and the overall CPI curve then flattened out for the rest of the year. This flatter curve will be the base for the year-over-year readings in the second half, and the reversing “base effect” will push up year-over-year readings. This is already baked in. Something to look forward to.
Inflation at a glance by major category:
- Services without energy services jumped by +6.8% from a year ago – after +7.1% in March and the four-decade high of +7.3% in February – fueled by housing, food services, auto insurance, auto repair, pet services. But declines in airline fares and rental cars pulled the other way. The infamous and huge health insurance adjustment also pulled the other way and will continue to do so through September.
- Food at home: inflation dipped in April from March, the second monthly decline in a row (-0.2%). Year-over-year, prices increased (+7.1%) at the slowest rate since January 2022.
- Energy inflation month to month rose (+0.6%) which slowed the year-over-year decline (-5.1%). Prices of gasoline rose for the month, but were still down (-12.2%) from a year ago.
- Durable goods CPI jumped month-to-month (+0.8%), the second month in a row of increases, after six months of declines, driven by a huge spike in used vehicle prices. This whittled down the year-over-year decline toward the flat line (-0.2%).
- Core CPI, on a month-to-month basis (+0.4%) has been in the same range for the fifth month in a row. On an unrounded basis, April was a little hotter than in March. Year-over-year, core CPI (+5.5%) has been stuck in the same range for the fourth month in a row.
- Overall CPI (CPI-U) accelerated month to month (+0.4%), but year over year moderated to +4.9%.
- Core CPI higher than overall CPI for the second month in a row. After the plunge in energy prices and the softening food prices, overall CPI has come down a lot, to +4.9% in April, while core CPI has gotten stuck at 5.5%.
“Core” CPI – which excludes the volatile food and energy products that consumer buy – jumped by 5.5% year-over-year in April, compared to 5.6% in March and 5.5% in February. Unrounded the difference was even smaller: 5.52% April versus 5.59% in March. Core CPI has been stuck in this very narrow range of 5.5% to 5.7% for the past five months without any meaningful improvement. This is what’s called “sticky inflation”:
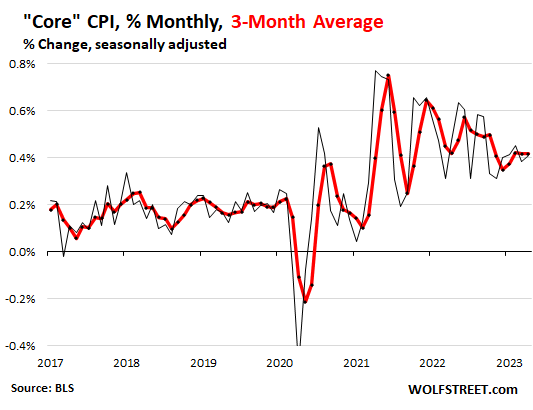
Month-over-month, core CPI jumped by 0.4%, same as in March. Unrounded, April (+0.41%) was a little hotter than March (+0.38%), shown by the black line in the chart below.
The three-month moving average of core CPI smoothens out the big monthly ups and downs and shows the trend a little more clearly (red line):
Core Services inflation (without energy services) jumped by 6.8% year-over-year in April, compared to 7.1% in March and the 40-year record of 7.3% in February. Nearly two-thirds of consumer spending goes into services.
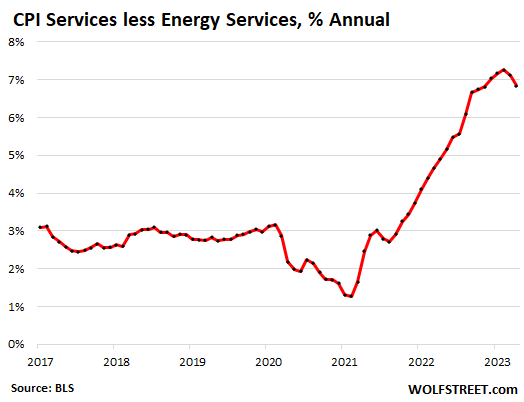
Month-to-month, services inflation without energy services jumped by 0.4% in March (0.36% unrounded), down from the 0.45% jump in March and 0.62% jump in February (black line). The three-month moving average is the red line.
The infamous adjustment to health insurance is included in medical care services, and pushed the otherwise surging medical care services index into the negative for the month, and toward the flatline year-over-year. This adjustment ends in September:
