

by Craig Hemke, Sprott Money:

In our 2023 macrocast, we forecast that the COMEX precious metals were likely to tread sideways through the first half of the year and then rally in the second half. As July ends and August begins, it appears that the expected second half rally has begun.
And we watched this new rally begin as prices moved off their recent lows last month. In early July, we noted that total contract open interest in COMEX silver had hit 10-year lows. This was almost a sure sign of a bottom and this post from July 5 made the point: No Demand for COMEX Silver
Next, on July 11, we noted that the price charts were beginning to turn higher, too: Looking for a Low
TRUTH LIVES on at https://sgtreport.tv/
And as July ends, be sure to note that, despite that very sharp drop on the 27th, COMEX gold is up about 2% on the month while COMEX silver is up over 8%. Not too shabby.


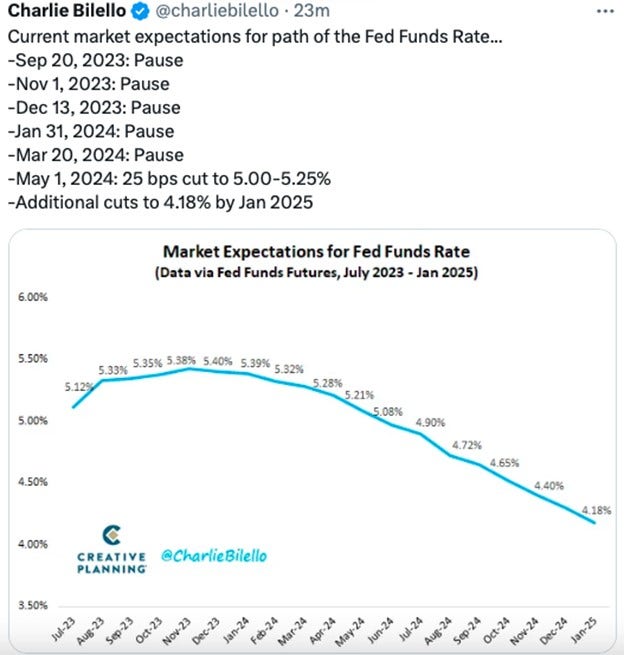
So now, where do we go from here? August is typically a slow news month, at least regarding monetary policy. Most of the Fed Goons take some PTO and we’re unlikely to hear from Chief Jerry Powell again until his annual Jackson Hole speech on the 26th. Between now and then, this Friday’s U.S. employment report will be key as well as the CPI data on Thursday, the 10th. As it stands right now, the fed funds futures market is showing no more rates hikes for this cycle and an expectation of rate cuts beginning in early 2024.
As for the markets in August, you should first and foremost keep an eye on the Dollar Index. If you’re a regular reader of these columns, then you’ll recall that we’ve been monitoring a downtrend of lower highs for the past several months. The area of support near 101 was recently broken and a test to regain that level is currently underway. If this attempt fails, then the possibility exists of a new lower low below 99 in the coming weeks.

Nominal interest rates must be monitored in August, too, as the yield on the U.S. 10-year note appears to be peaking again near 4.00%. If rates begin to roll over and move lower like the Dollar Index, buying pressure in the COMEX precious metals will accelerate.

August into September is seasonally a very good period for precious metal prices, too. See the chart below from Bullion Vault:

So let’s watch to see what happens this month. By month end, the monetary narrative for the remainder of the year may be quite different than what it is right now, resulting in falling rates and dollar index. If that’s the case, then we should expect the seasonality of the precious metals to kick in and set us up for a string final third of the year.
In terms of price, the targets to watch are shown on the charts below. If Dec 23 COMEX gold can break and hold above $2040 (just a +1.5% move from here), then the April-May highs in $2080-$2100 area will come into view. Note that after a double bottom established the lows in early March, price appears to be tracing out a reverse/inverse head-and-shoulder bottom this time around.
