

by Jan Nieuwenhuijs, Gold Seek:

The US dollar price of gold has been declining in the past two months, though it continues to show significant strength against the 10-year TIPS yield, to which it was tightly correlated from 2006 until 2021. Gold’s performance since early 2022 must be seen as bullish.
TRUTH LIVES on at https://sgtreport.tv/
Credit: Pixy.org Copyright: CC BY-NC-ND 4.0
A big change has occurred in the gold market since Russia invaded Ukraine and the West seized the euro and dollar denominated assets from Russia’s central bank. Regardless of the price declining for the last two months, gold performance since February 2022 is momentous because it’s finally beating a pricing model that ruled from 2006 through 2021.
What Sets the Price of Gold
The most important driver for the US dollar gold price is the 10-year yield on Treasury Inflation Protected Securities (TIPS). For roughly 15 years, gold and TIPS were tightly inversely correlated. Because owners of TIPS are compensated for inflation, the TIPS yield can be seen as the expected real interest rate. Also referred to as “real rates,” in short. The logic behind the correlation is that gold serves as a hedge on US government bonds (Treasuries), as gold has no counterparty risk. Gold is thus priced higher when the TIPS yield falls and vice versa. For detailed information please read my primer on TIPS.
The formula for the TIPS yield is:
TIPS yield = nominal Treasury yield – inflation expectations
In the chart below you can see that the correlation between the gold price and the TIPS yield started weakening in early 2022, when Russia stormed Ukraine. As the TIPS yield went up from -1% in February to +1.7% in November 2022, gold went down from $1,900 an ounce to $1,700, instead of $1,000 as previously suggested by the model. The tight correlation had changed to the upside because the market acknowledged more risk in holding Treasuries.
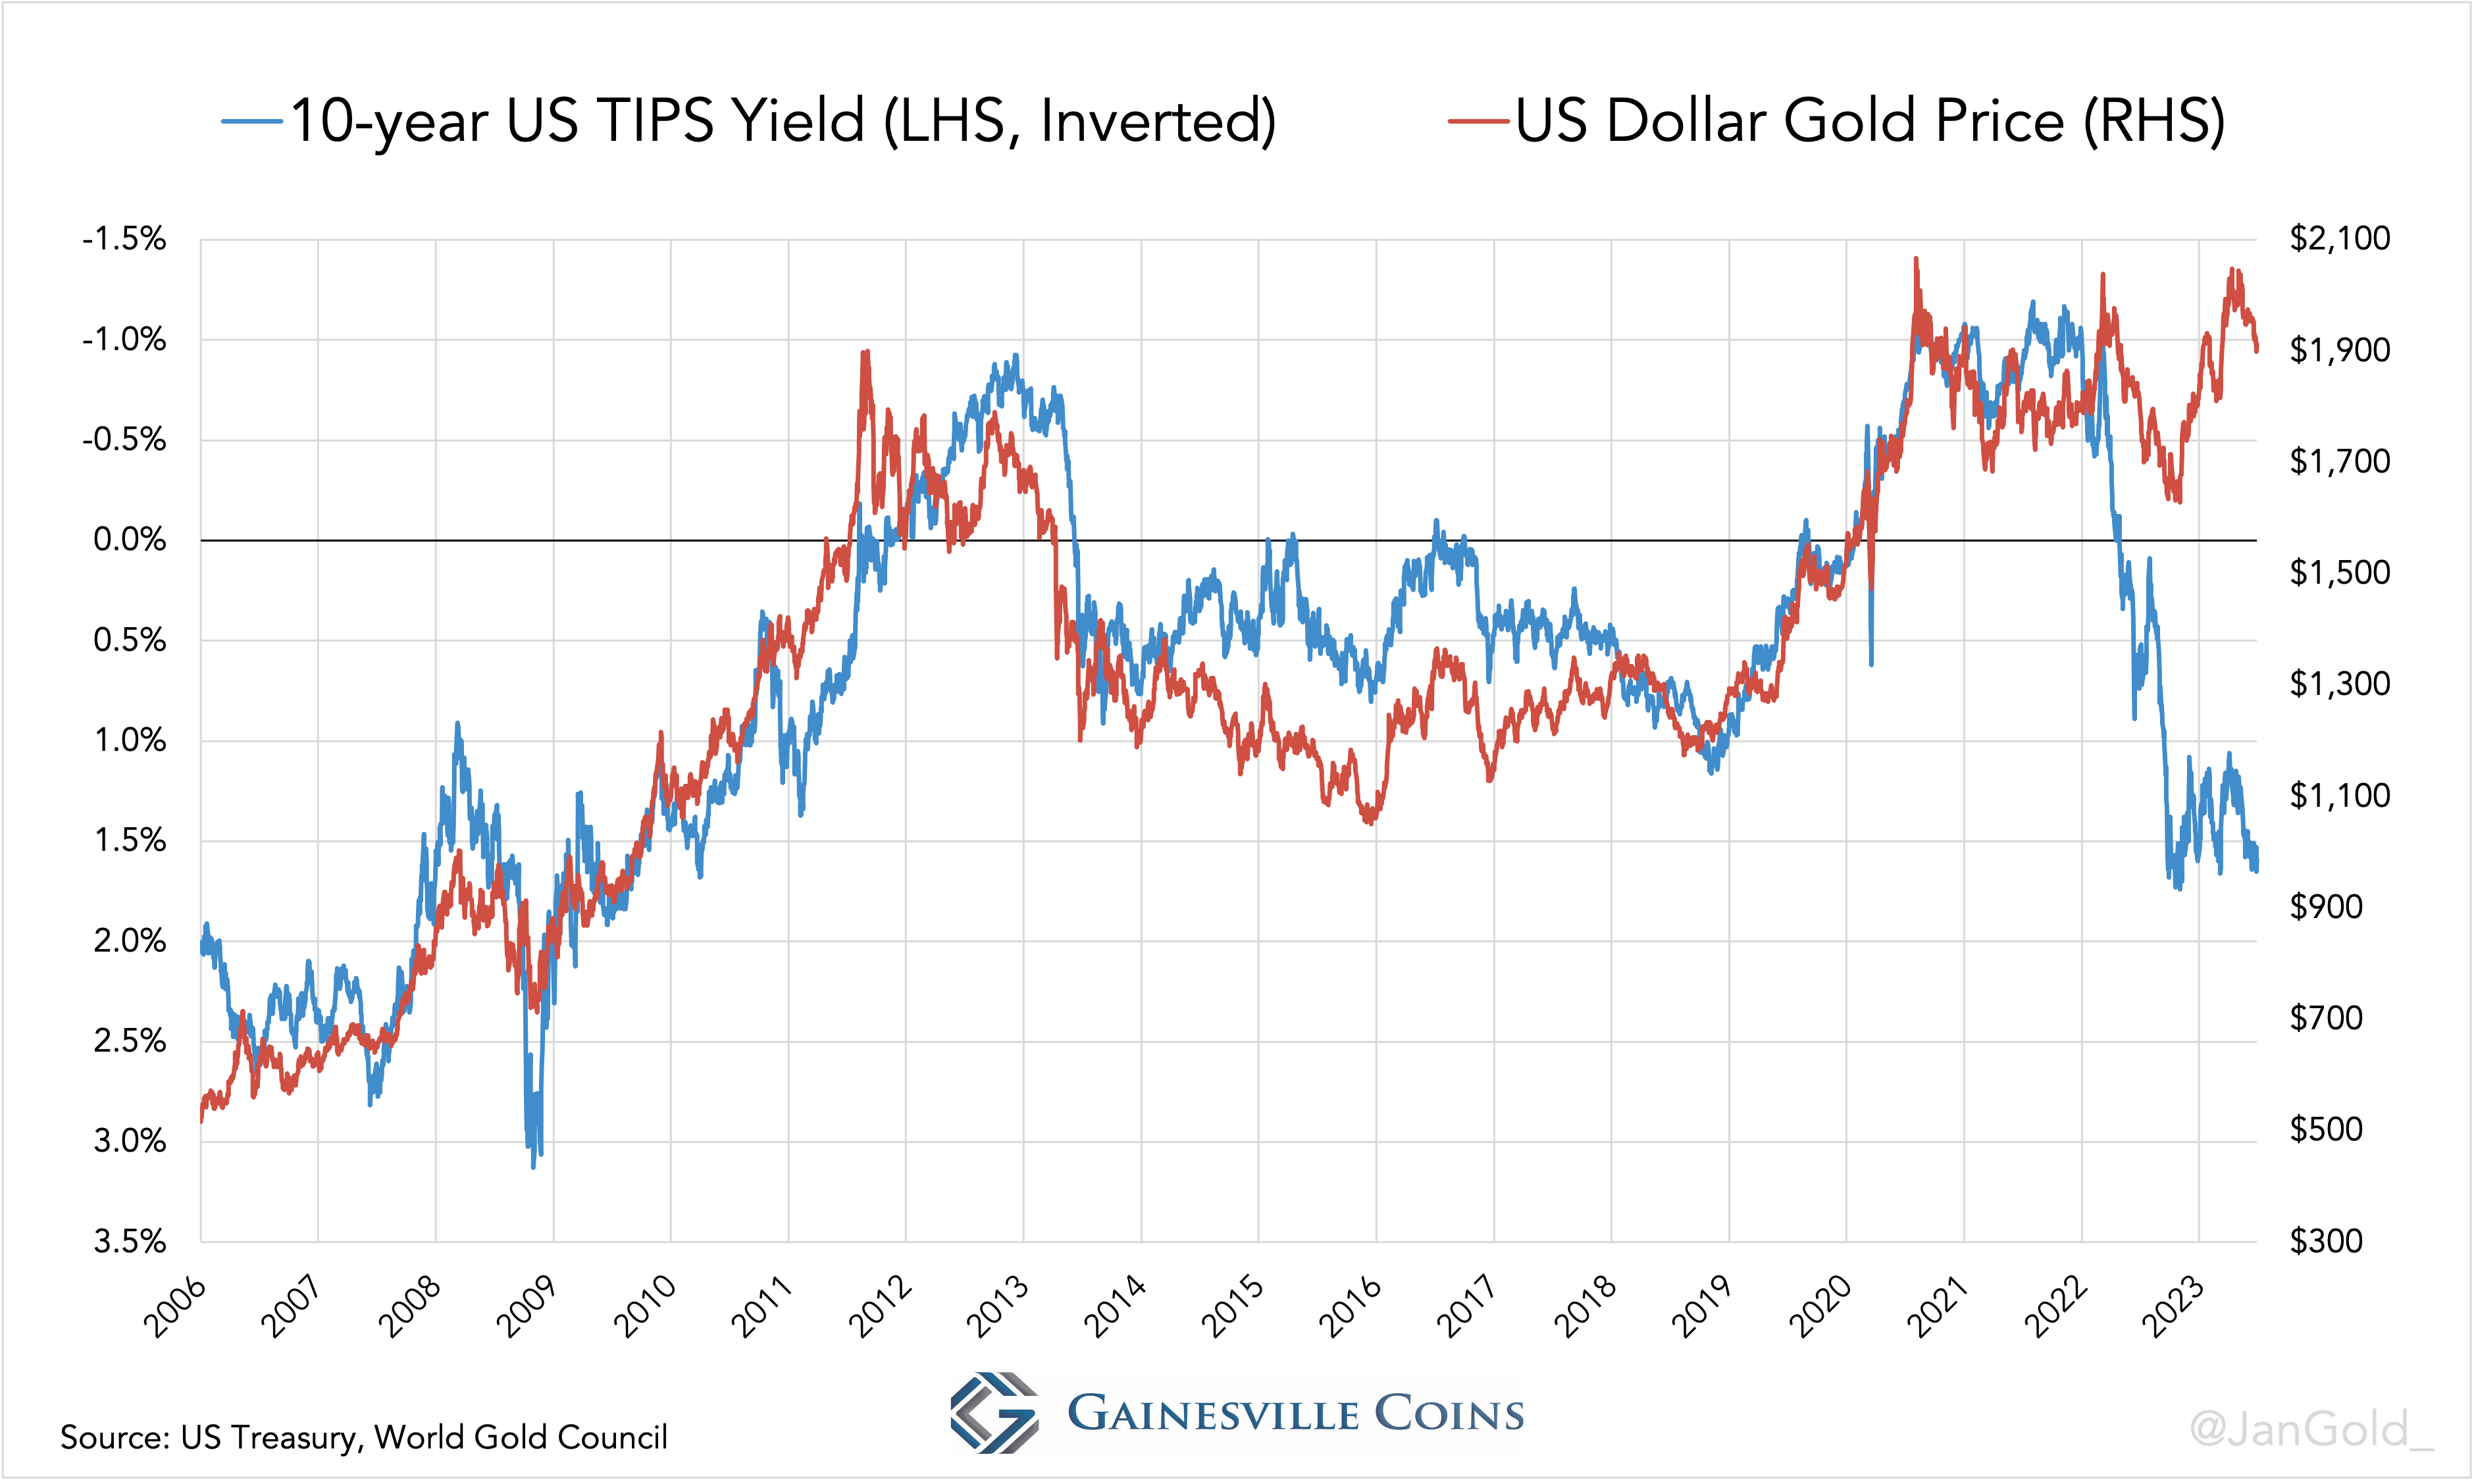
The TIPS yield axis is inverted.
In November 2022 I wrote:
Gold is in a transition phase. In the past nine months two key developments—war and inflation—have made gold trade much stronger than how it was priced from 2006 through 2021. Both developments are likely to stick around in the coming years and will prove a tailwind for gold.
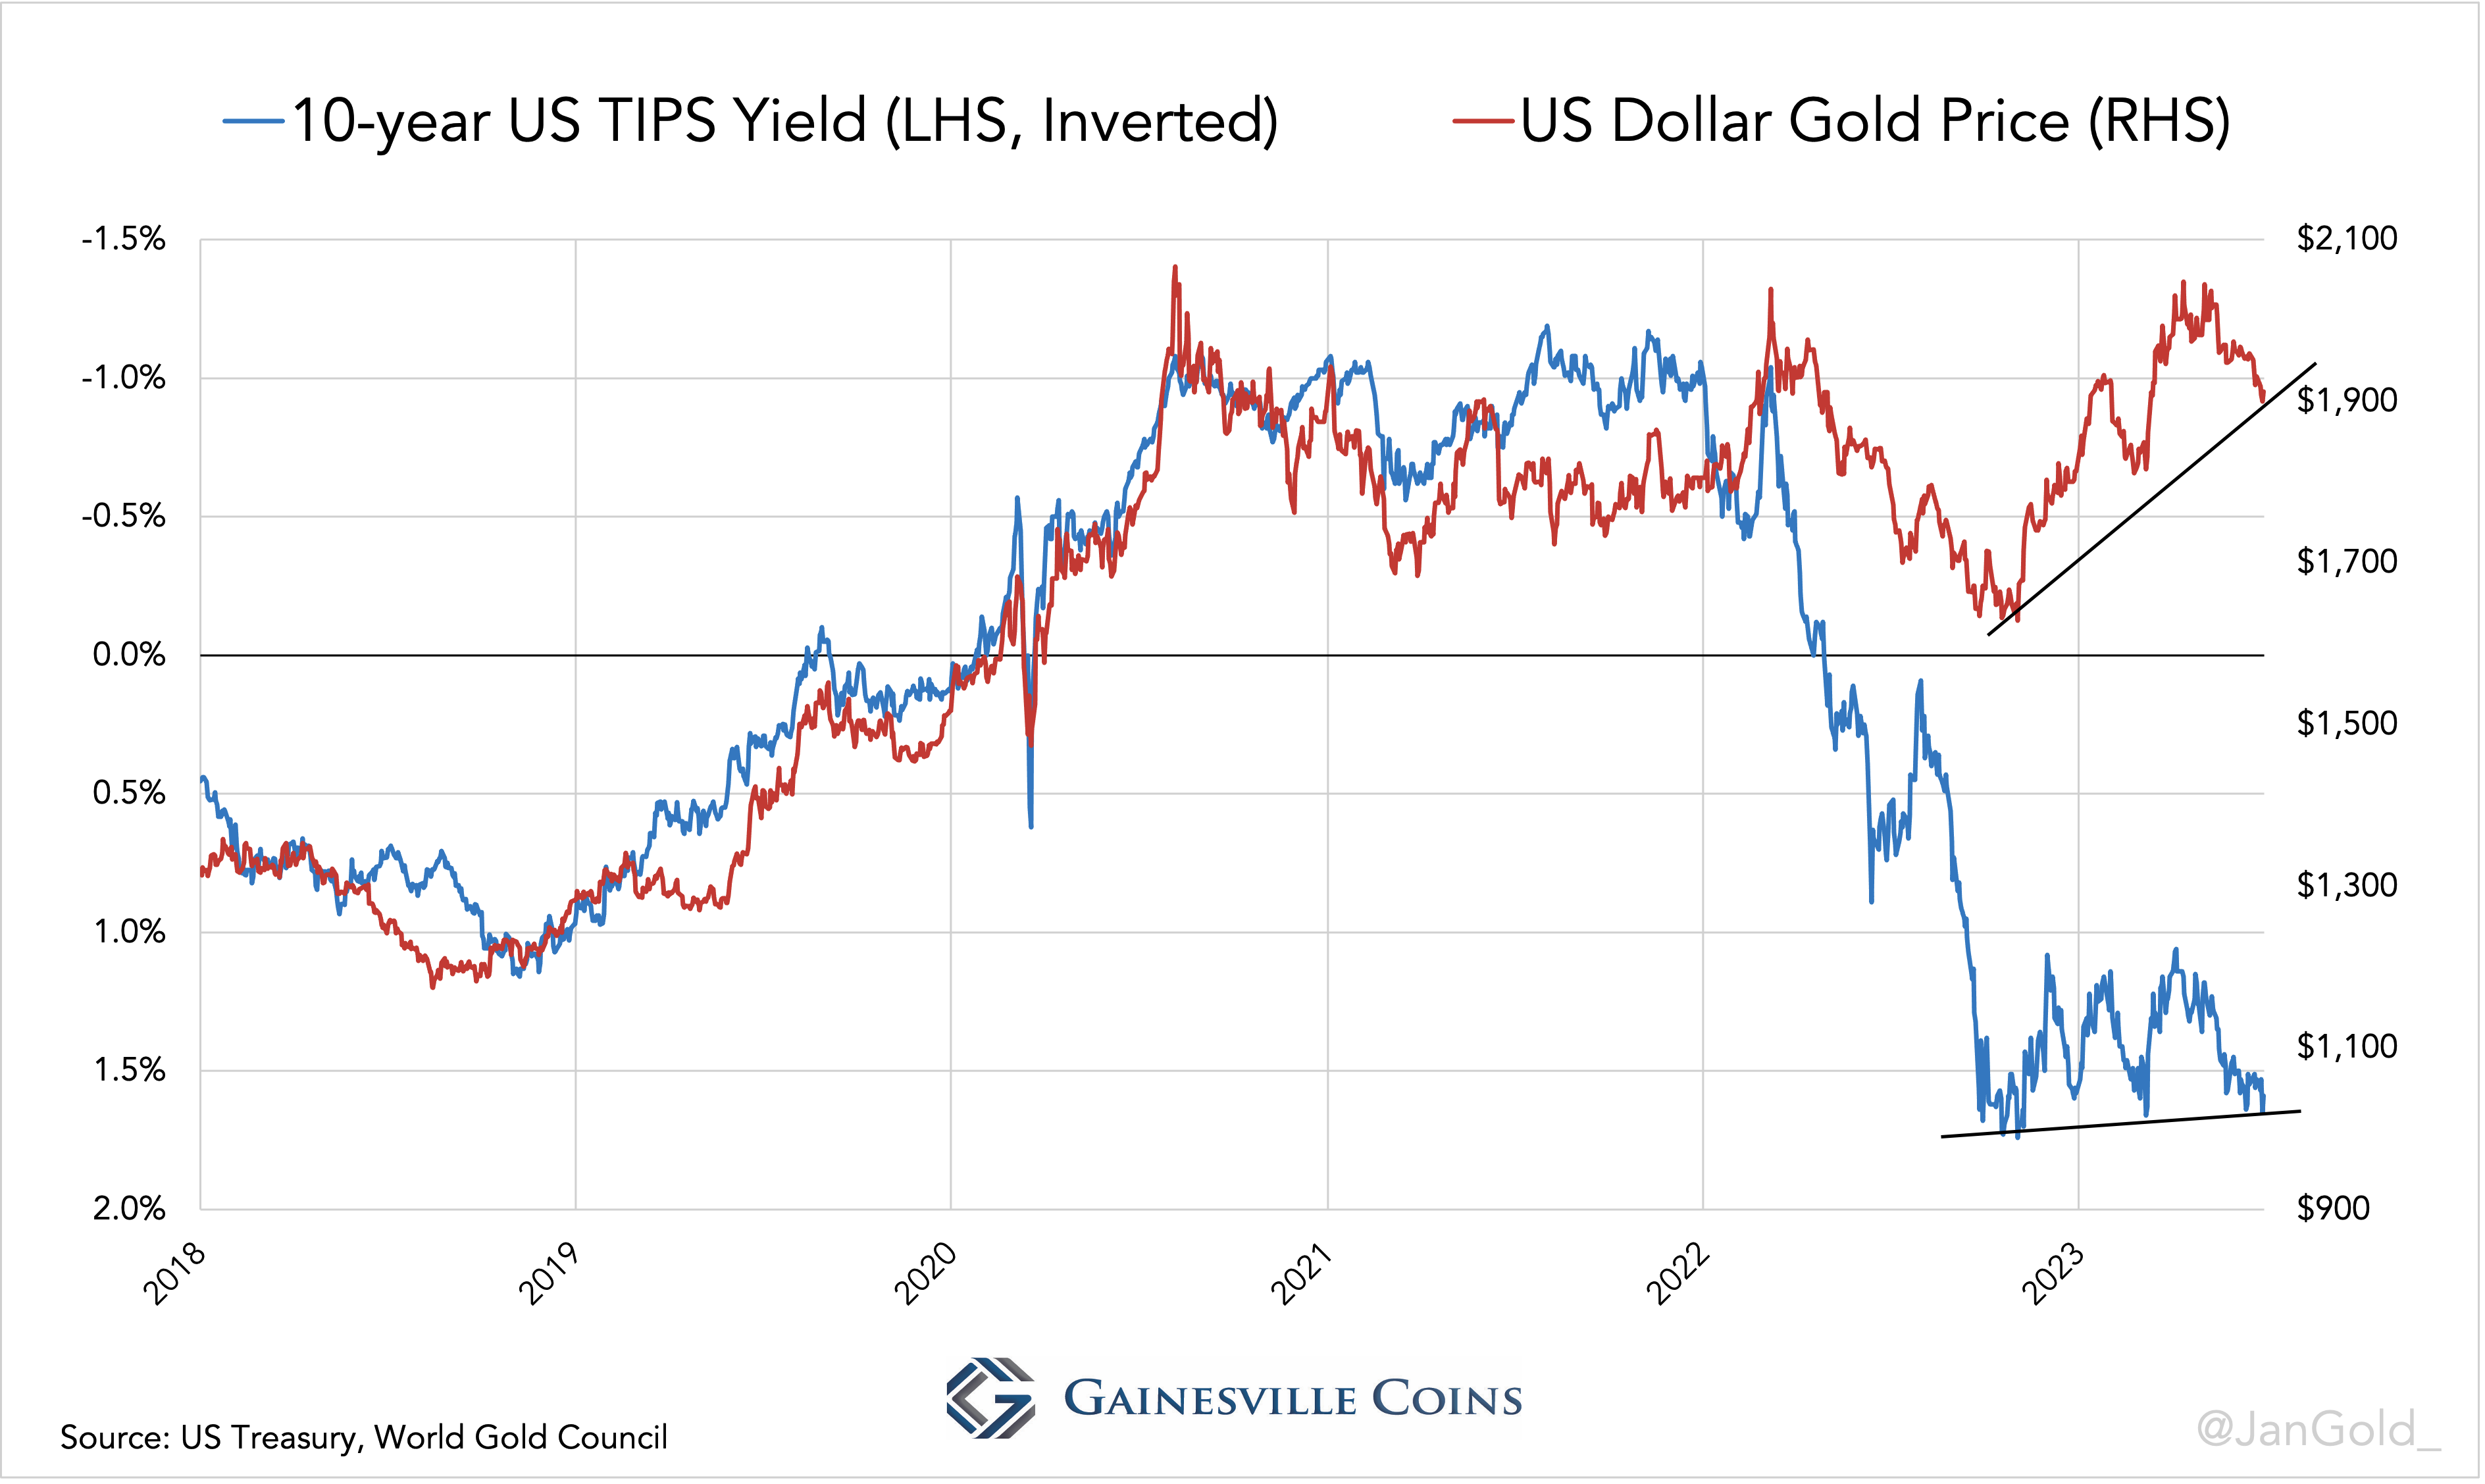
Since November 2022, the TIPS yield has slightly trended down, while the gold price has been firmly going up! Gold is still sensitive to the TIPS yield, but the gap in the chart between real rates and gold is widening.
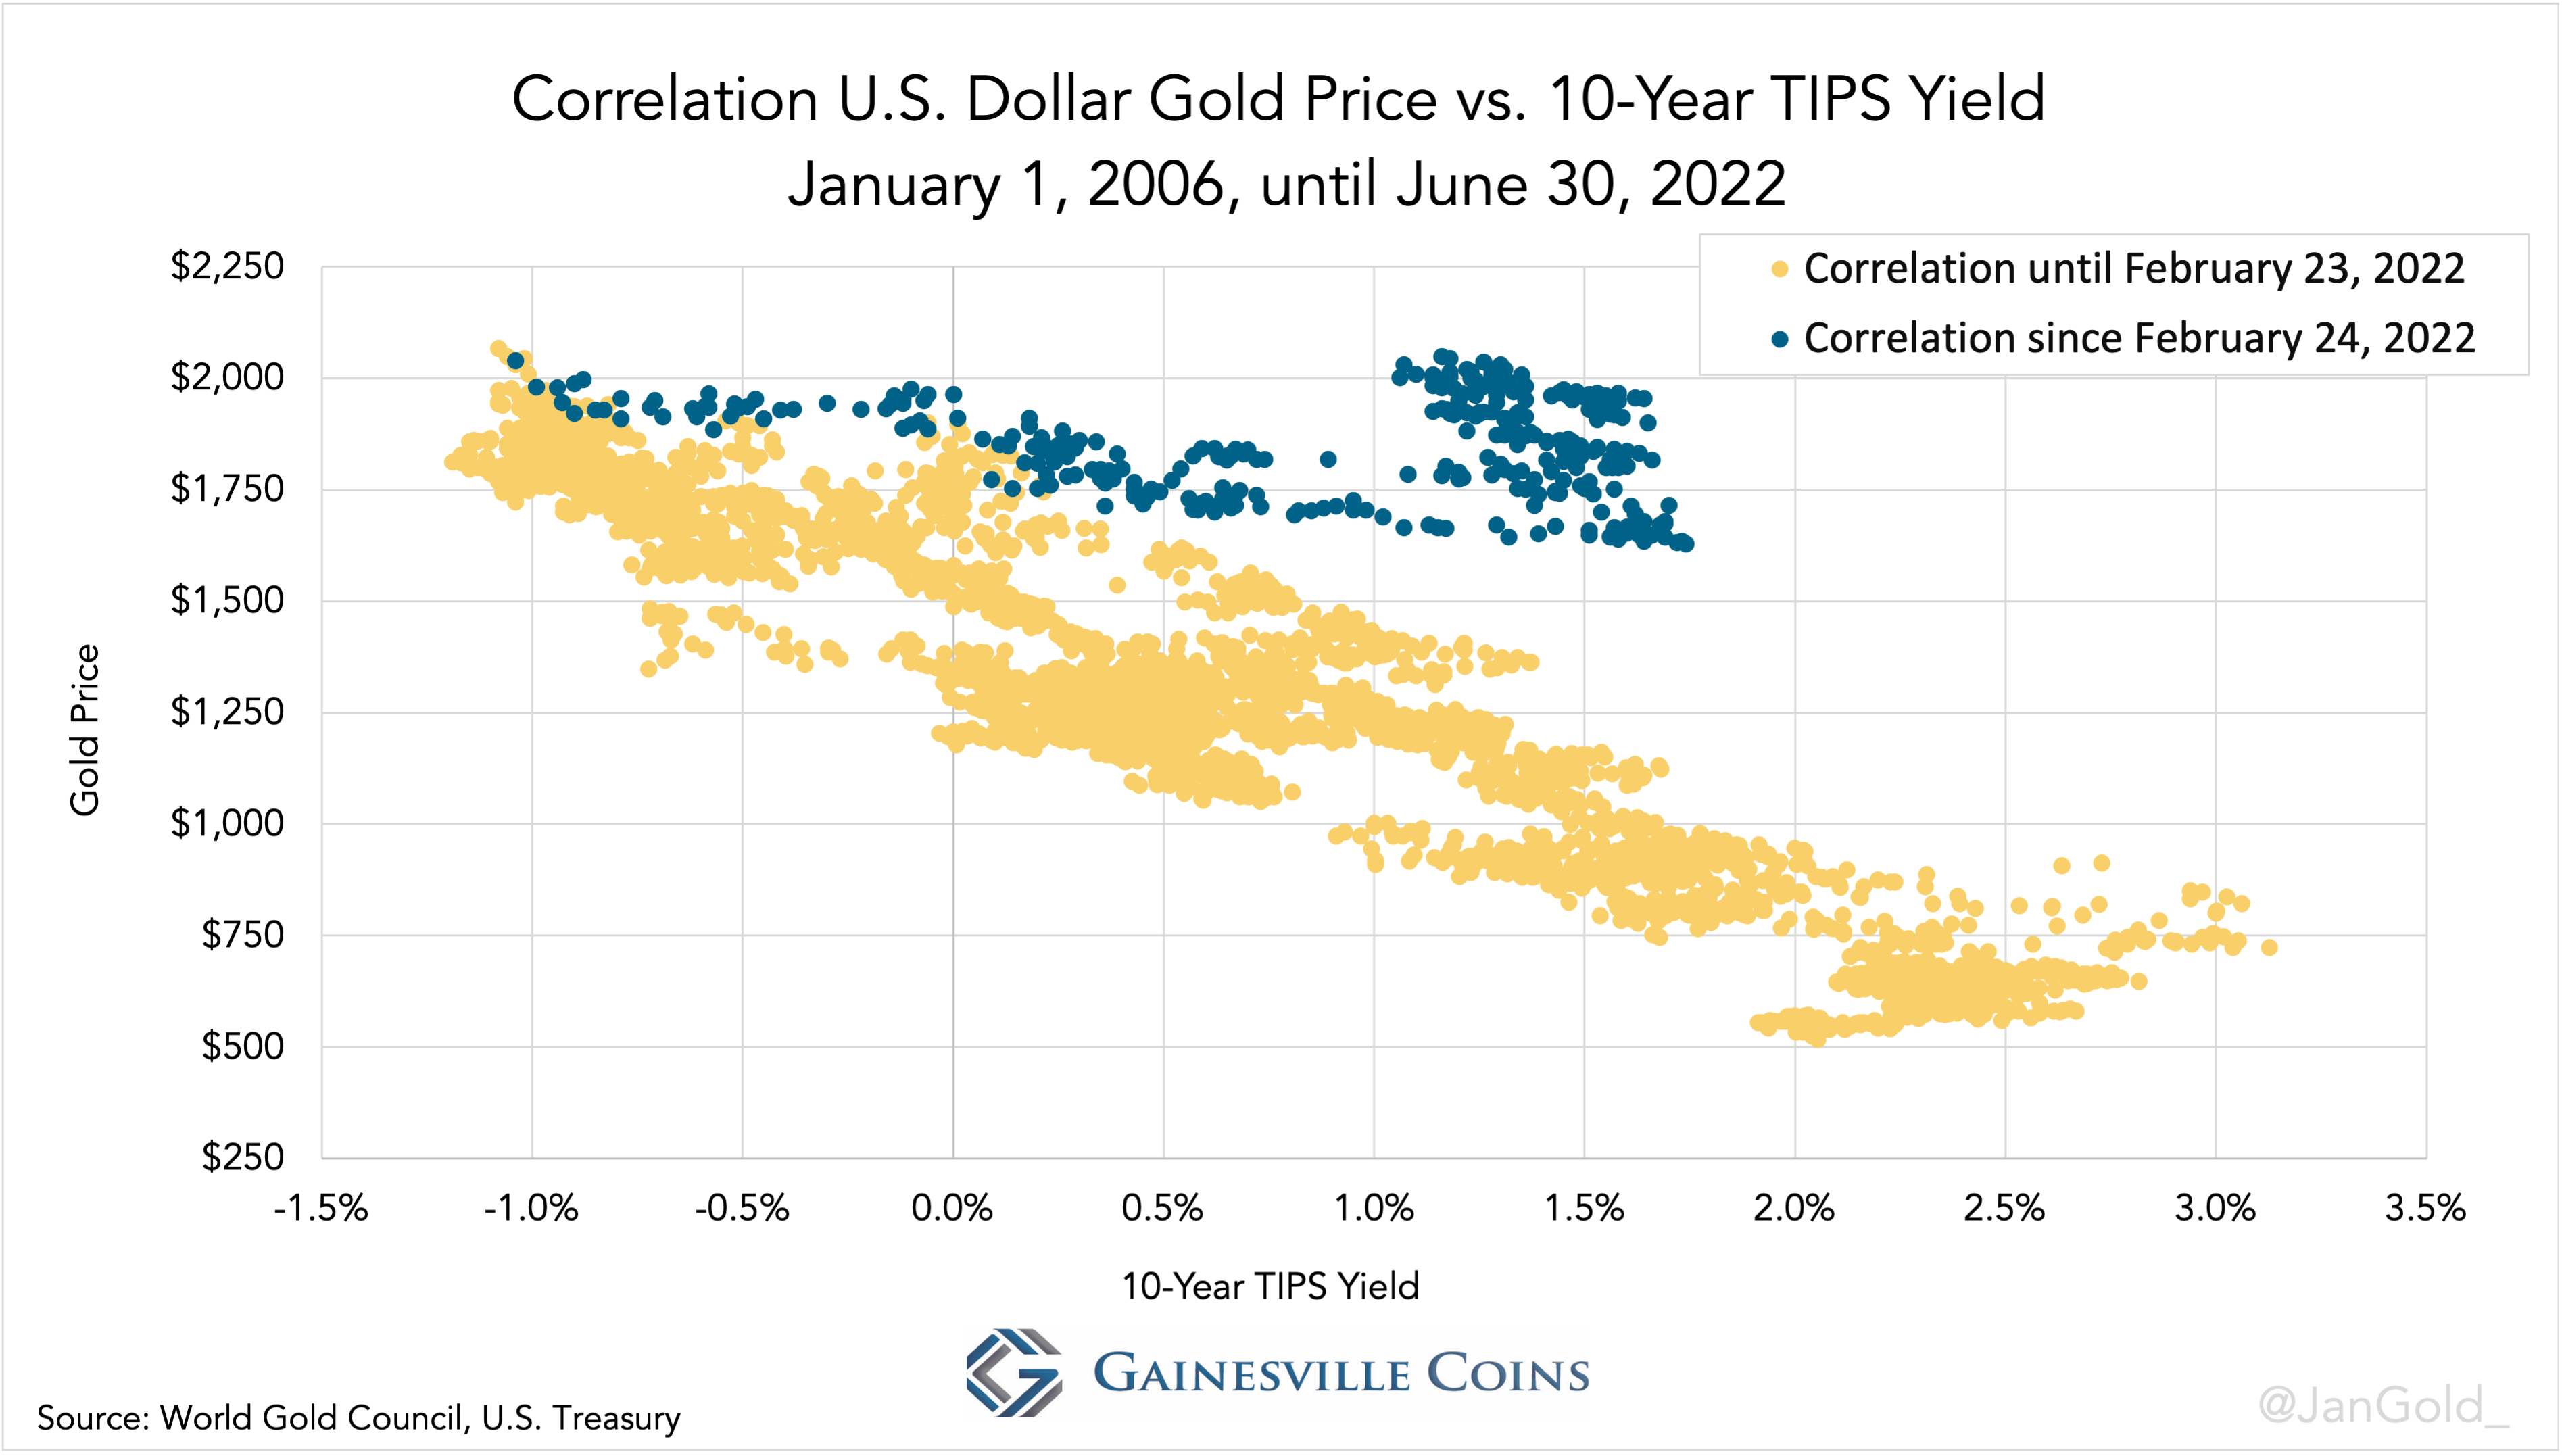
In a scatter plot the change in the correlation can be recognized by the dots walking out of a diagonal cloud. When dots form a new diagonal cloud, the correlation strengthens.
Based on the old model, gold should be trading around $1,000, yet a fine troy ounce in the wholesale market is being exchanged for $1,900 at the time of writing. That’s a massive gap, which I don’t expect to subside.
Why the TIPS Model Had to Change
In my view, the tight correlation had to change some day as it didn’t make a lot of sense to begin with. Consider the following: in the TIPS model, gold is trading as a hedge on US government bonds—the backbone of the international monetary system. Every year, though, the total value of US government bonds grows much faster than the total value of the above ground stock of gold. The US fiscal deficit (the growth in value of bonds outstanding) in 2022 was $1.38 trillion dollars, while the value of newly mined gold was $200 billion. The tight correlation has an asymmetry in it.