

by Peter Schiff, Schiff Gold:

Seasonally Adjusted Money Supply in April fell $167B. As the chart below shows, this is now the 9th consecutive monthly drop. This is also the second-largest drop of all time, behind only last month.
TRUTH LIVES on at https://sgtreport.tv/

Figure: 1 MoM M2 Change (Seasonally Adjusted)
Below are the unadjusted raw numbers which are slightly ahead of the adjusted numbers. The orange bar aligns with the same time period as the orange bar above. April came in as a drop of $196B which is very close to the adjusted number. May is only showing one week so far but is already negative by $36B. At the same time last month, April was positive by $55B, so May could be setting up for another big drop.
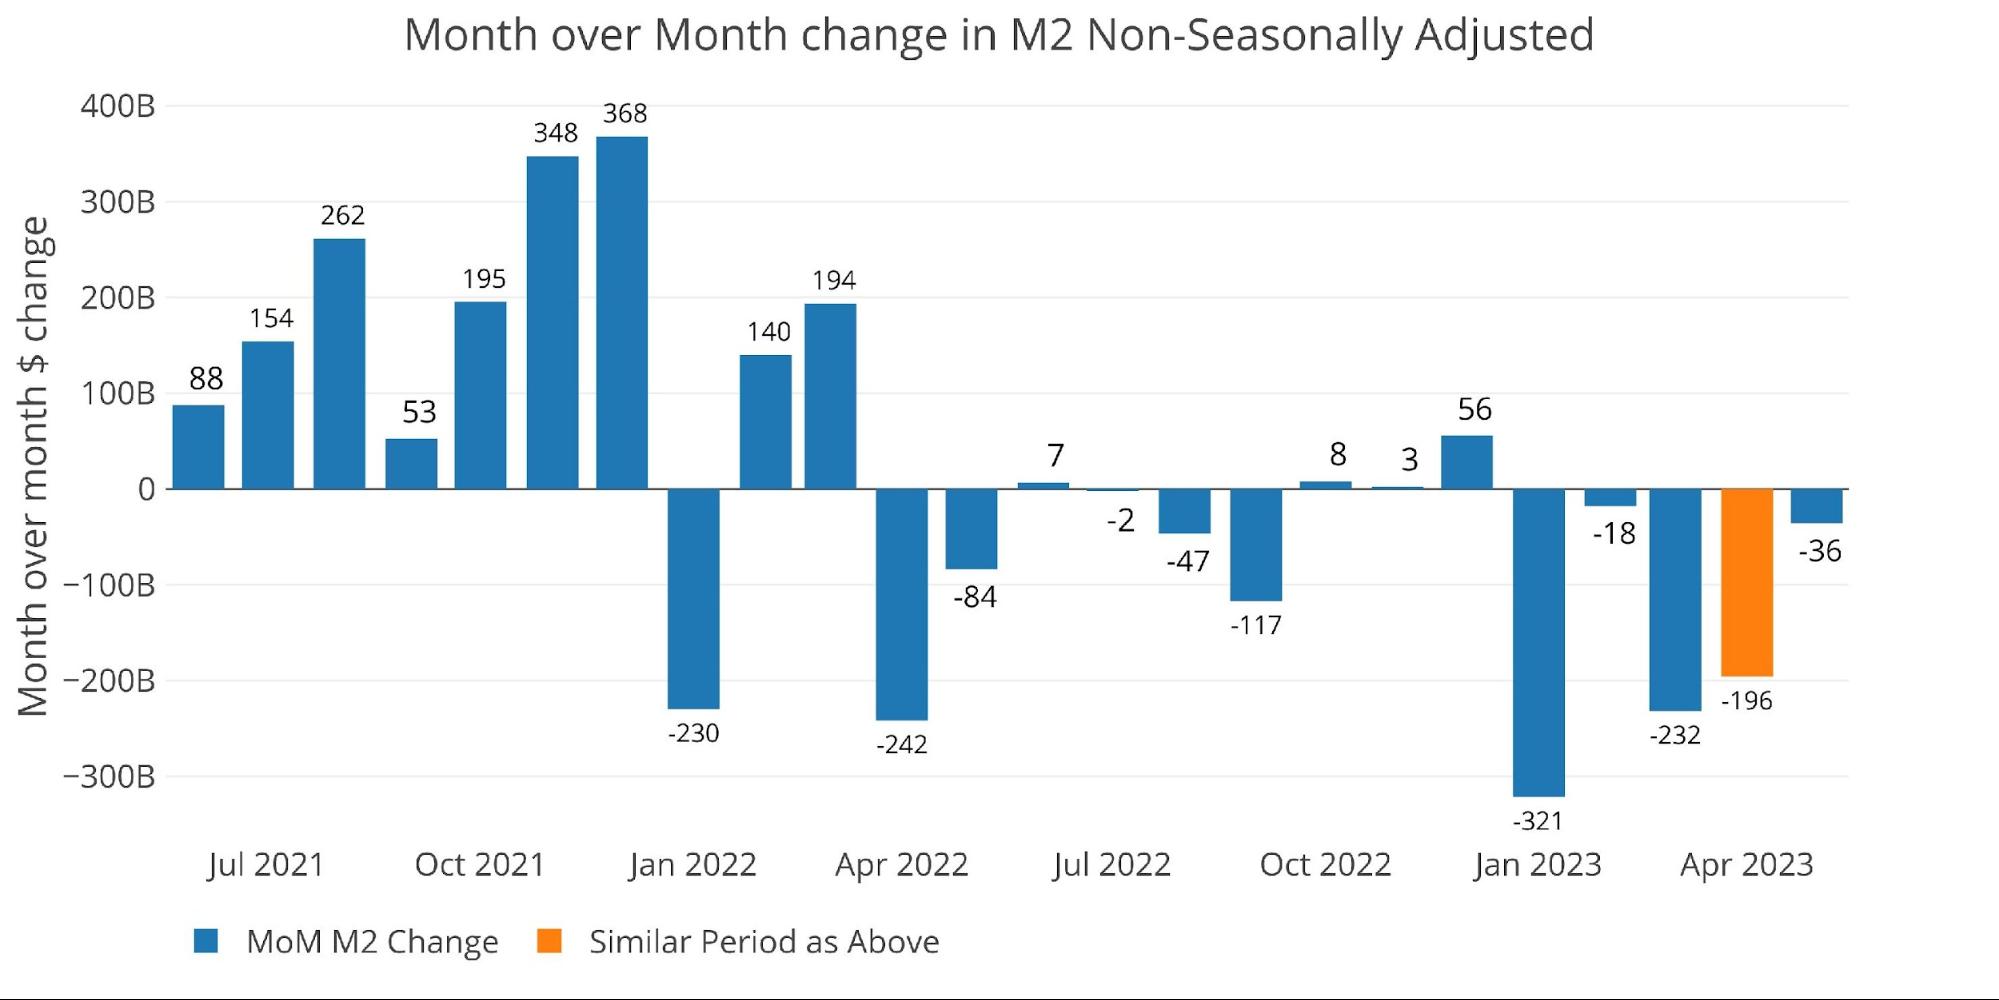
Figure: 2 MoM M2 Change (Non-Seasonally Adjusted)
Looking at the seasonally adjusted numbers shows that this month decreased the Money Supply by -9.2% annualized which is below both the 6-month and 12-month trend (-7% and -4.6% respectively).

Figure: 3 M2 Growth Rates
The average for March (pre-Covid) was 5.1%. Historical money supply was typically increasing at this time of year but is now dropping further into negative territory. This can be seen even more clearly by the next data set below: 13-week money supply.
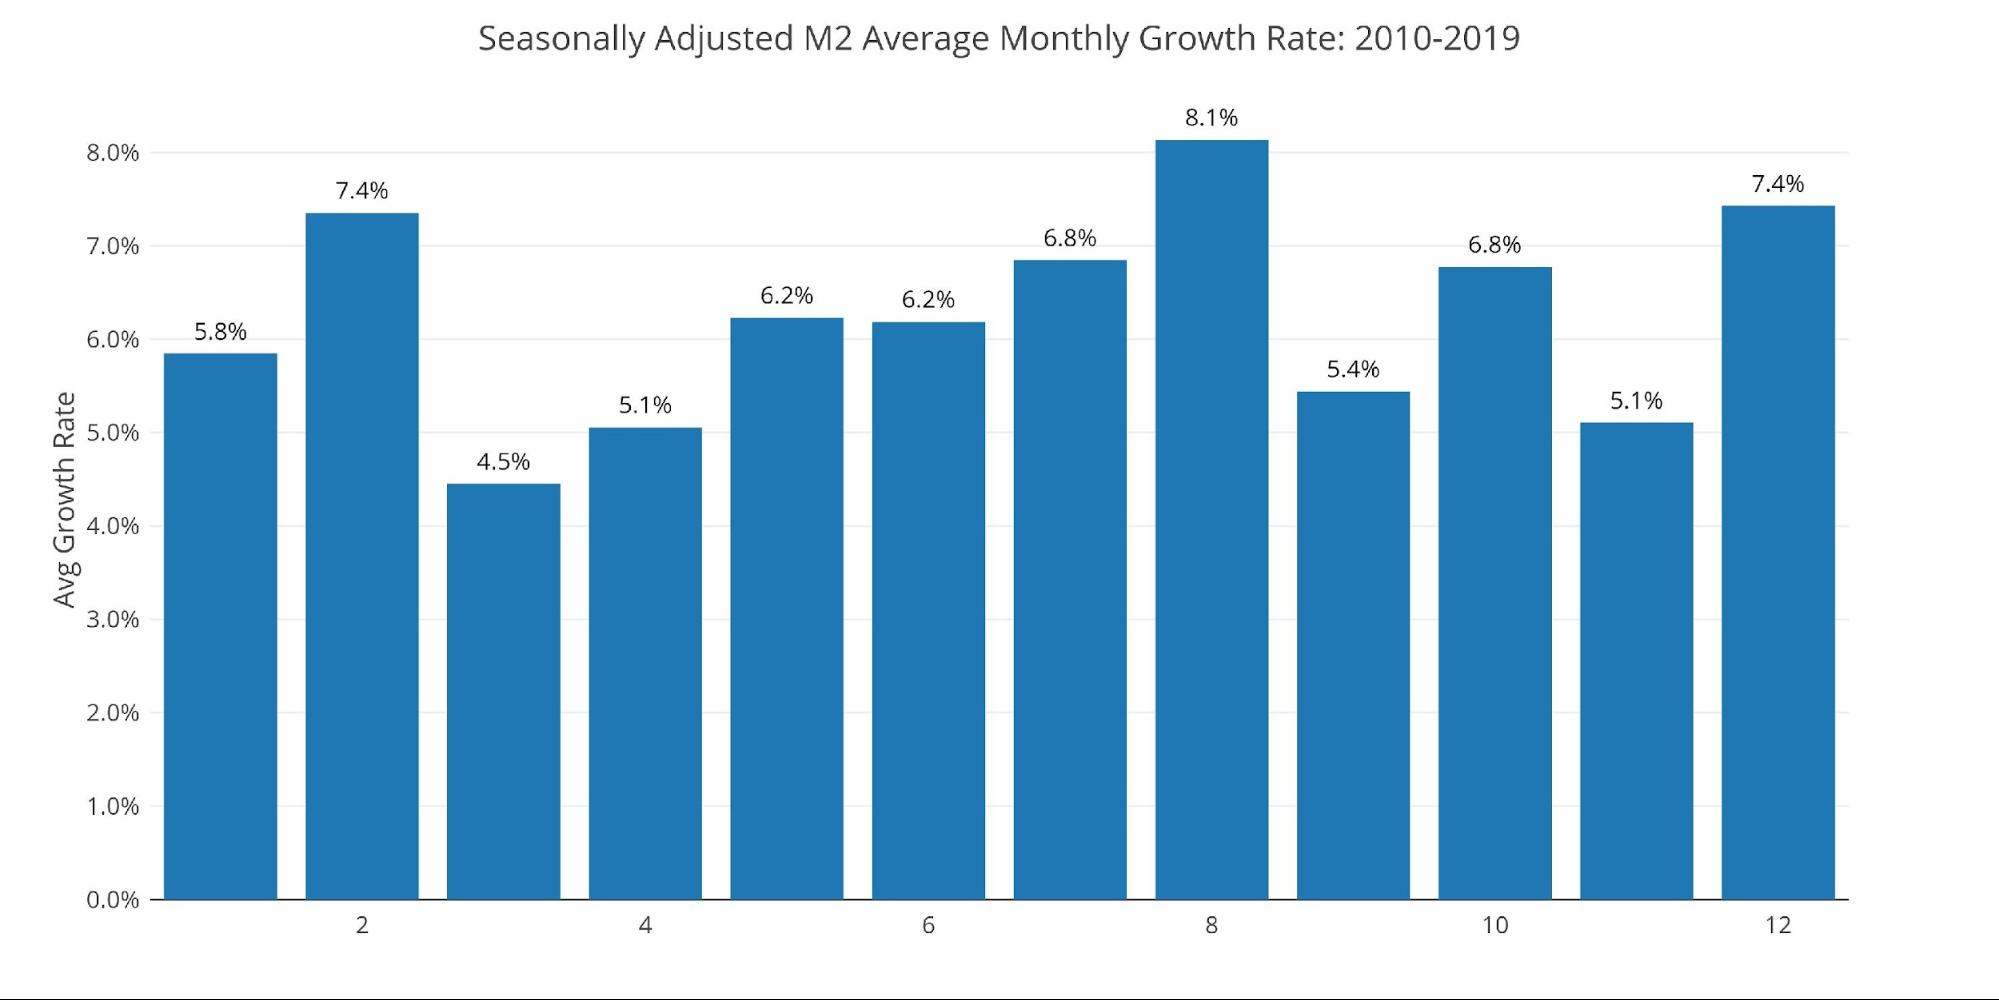
Figure: 4 Average Monthly Growth Rates
First, it is interesting to see the weekly raw data shown below. The negative drops have gotten both larger and more frequent. This data is used to calculate the running 13-week money supply.
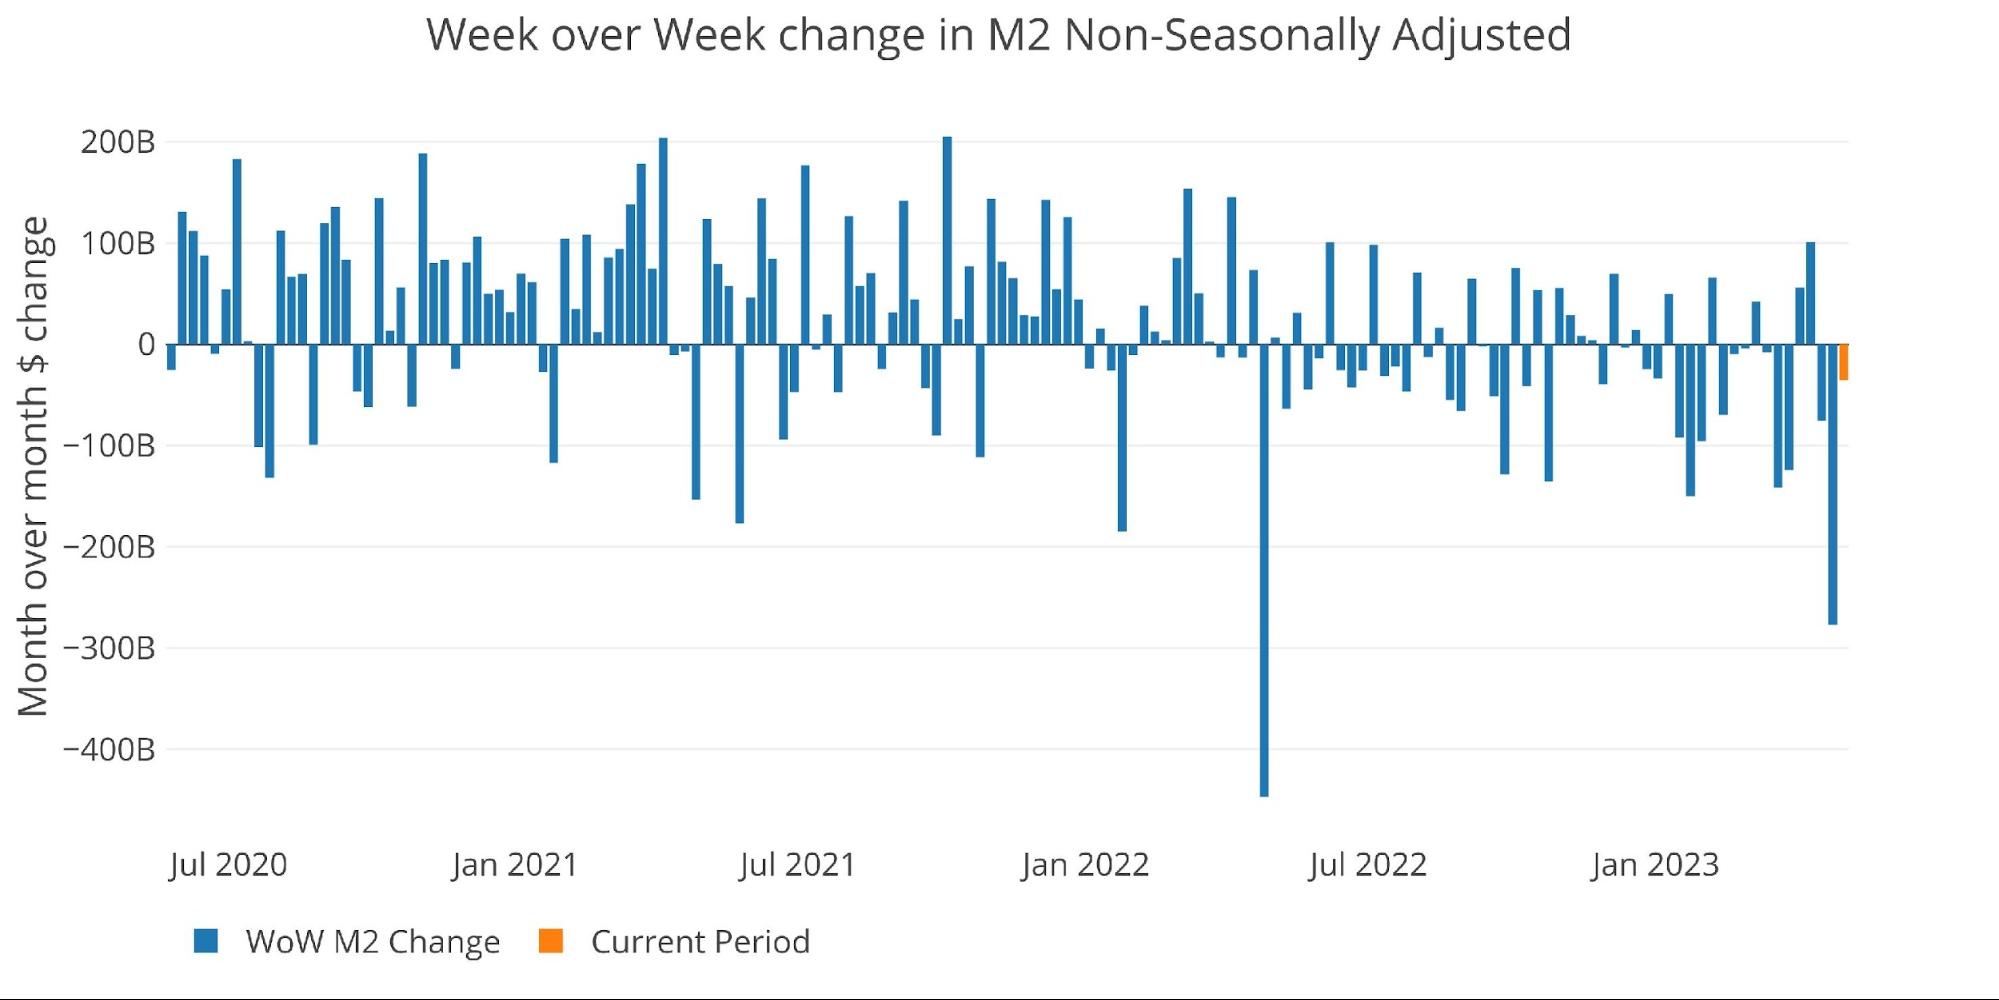
Figure: 5 WoW M2 Change
The “Wenzel” 13-week Money Supply
The late Robert Wenzel of Economic Policy Journal used a modified calculation to track Money Supply. He used a trailing 13-week average growth rate annualized as defined in his book The Fed Flunks. He specifically used the weekly data that was not seasonally adjusted. His analogy was that in order to know what to wear outside, he wants to know the current weather, not temperatures that have been averaged throughout the year.
The objective of the 13-week average is to smooth some of the choppy data without bringing in too much history that could blind someone from seeing what’s in front of them. The 13-week average growth rate can be seen in the table below. Decelerating trends are in red and accelerating trends in green.
The 13-week average has now reached a new all-time low of -7.2%. the growth rate has decelerated for 14 straight weeks and has remained negative for 45 weeks. This type of slowdown is completely unprecedented.
For almost a year, I have been flagging the massive drop in Money Supply. So far, only crypto and a few regional banks have been hit, but there is unquestionably a storm brewing. This crash in money supply is way worse than what was seen in 2000 and 2008. With the market so much more dependent on cheap money now, it’s only a matter of time before something major breaks.