by Steve Kirsch, Steve Kirsch’s newsletter:
 How can the CDC ignore their own gold-standard data? The data shows the COVID vaccines were a huge failure and increased all-cause mortality, exactly the opposite of what was promised.
Executive summary
This article has four new charts from Medicare data that have never been revealed publicly.
Key takeaways:
TRUTH LIVES on at https://sgtreport.tv/
- The COVID vax increased baseline risk of death in the elderly by over 10%. This is very consistent with what Denis Rancourt and others have found.
- Since April 2022, the unvaccinated fared better than the COVID vaccinated from a mortality perspective (this could be true earlier than April 2022, but I currently lack the data to show this): there were no COVID “humps” and the seasonal increase in mortality was lower than for the vaccinated.
- COVID hasn’t been killing anyone since April 2022 in any significant numbers. This means that there was absolutely no reason for anyone to get a booster shot after April 2022. Even if the vaccine were safe and worked perfectly, there is no data supporting such a need.
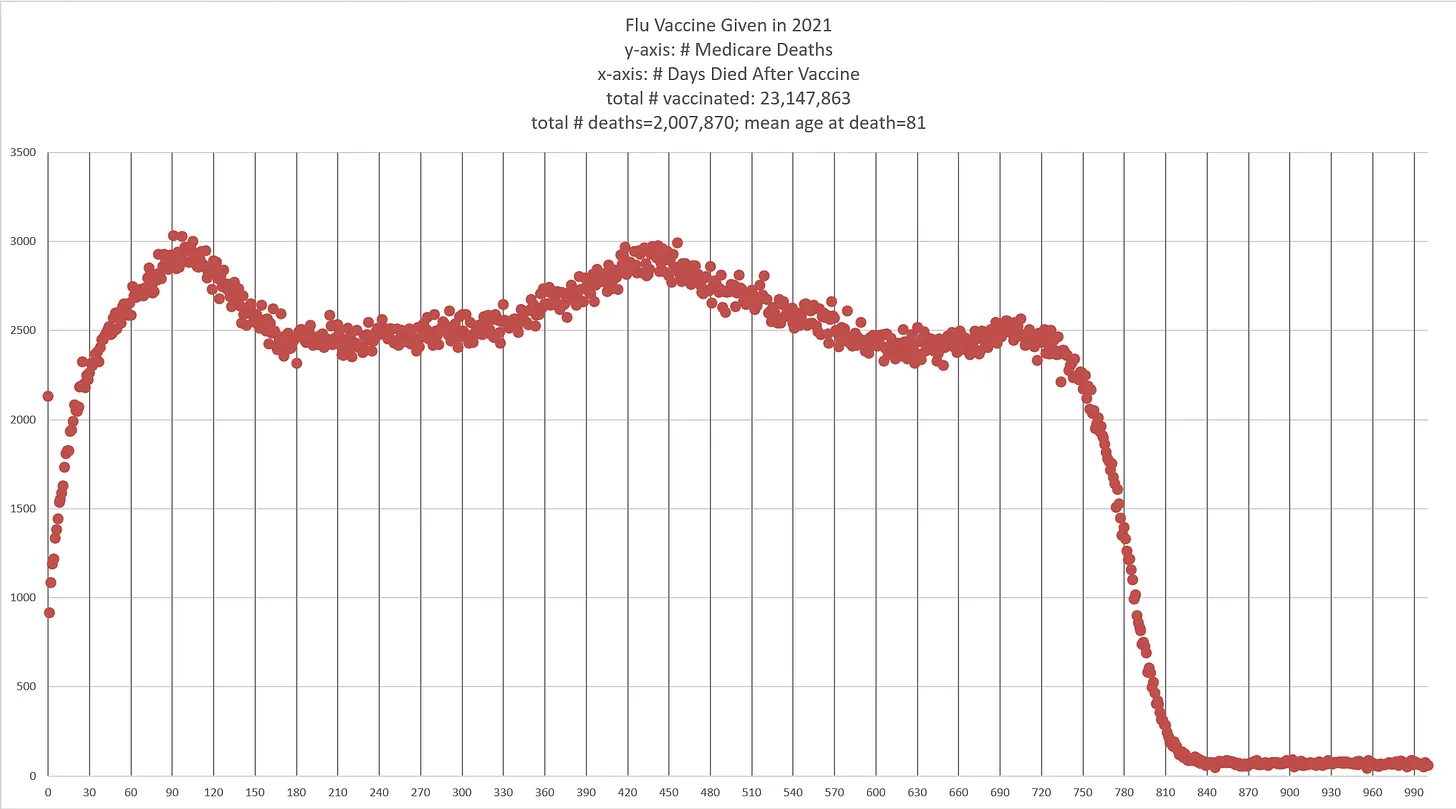
- The flu vaccines have a “Day 0” mortality rate that exceeds the “1 excess death per M doses” criteria for a safe vaccine. The flu vaccines are clearly unsafe and should be immediately pulled from the market. Flu vaccines also have no hospitalization benefit whatsoever as was pointed out in a JAMA paper published in April 2023. The flu shots simply kill people for no benefit. The data is in plain sight for all to see.
- The CDC never cites the Medicare data as proof of vaccine safety and efficacy for any vaccine because the data shows the opposite. All data is kept hidden from public view. So you’ll never see any of the graphs shown in this article from the CDC even though they have the data. They basically only publish data that fits the narrative.
- The mRNA COVID vaccines should be pulled from the market. They are literally doing the opposite of what was promised.
- The flu vaccine should be pulled as well. While the flu vaccine isn’t nearly as deadly as the COVID vaccine, it is an unsafe vaccine with no measurable clinical benefit.
If the vaccines were safe, the CDC would be inviting all the top “misinformation spreaders” to CDC headquarters to do as many queries as we would like on VSD, Medicare, and Medicaid. But there is no such open invitation. On the contrary, they immediately cut off database access to anyone who ever gets close to finding something that goes against the narrative like they did with Brian Hooker when he was researching the link between vaccines and autism.
We are open to being challenged on the data, they are not
Unlike the world’s health authorities, those of us who challenge the “scientific consensus” embrace open debate and challenge.
If there are any epidemiologists who would like to challenge me on the interpretation of the charts below or challenge Denis Rancourt on his paper, simply respond in the comments below.
Definitions
HVE: The healthy vaccinee effect. This depresses the mortality rates observed within around 30 days after a vaccine is given. The reason for this effect is because people who are in hospice and hospitals aren’t generally injected with vaccines. Therefore, if you track deaths on the first 30 days after a vaccine is given, it will normally show impossibly low death rates. High death rates on Day 0 are therefore a huge safety red flag. The 30 day period is observed in other vaccines and other countries.
Baseline death rate: The lowest rate of death over a 365 day period for a given cohort, e.g., the death rate when nothing special is going on in the background. Even with things like COVID going on, because COVID typically comes in waves, the mortality rate will normally spend a significant amount of time at or near the baseline rate during a 365 day yearly cycle.
Summary of the key points in the analysis below
The analysis below follows a fixed cohort that was defined by “those in Medicare who got their first shot in March 2021.”
We follow that group of people over time and find that their baseline death rate has increased from their baseline measured shortly after getting the shot.
We also show that the effect is happening within the first 120 days for certain because the deaths per day slope is positive even though all-cause deaths are decreasing (due to seasonality). In short, if you got the shots, your mortality is going up when it should be going down. We see this in other countries as well after the shot is given.
Read More @ kirschsubstack.com


