

by Peter Schiff, Schiff Gold:

Seasonally Adjusted Money Supply in March fell $257B. As the chart below shows, this is now the 8th consecutive monthly drop. Going back to the 1970s, the drop in March was actually the biggest on record from an absolute and relative basis.
TRUTH LIVES on at https://sgtreport.tv/
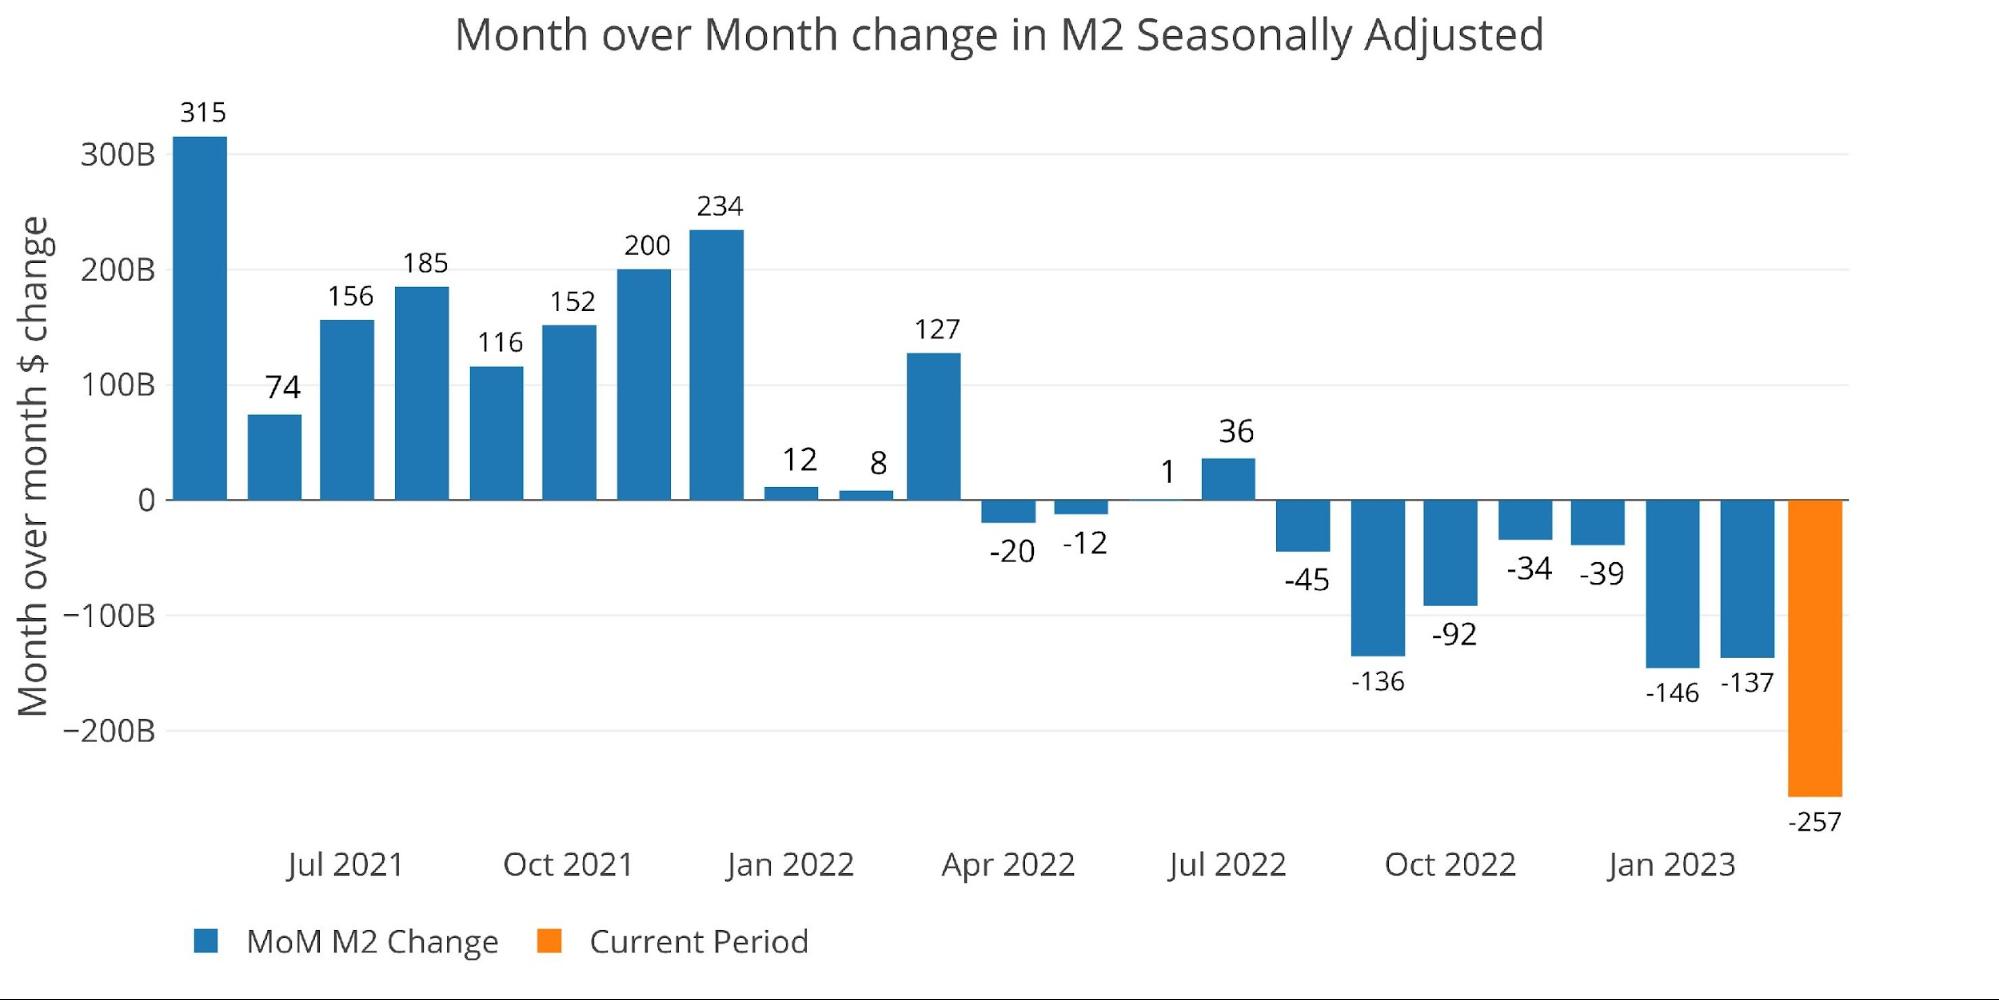
Figure: 1 MoM M2 Change (Seasonally Adjusted)
Below are the unadjusted raw numbers which are slightly ahead of the adjusted numbers. The orange bar aligns with the same time period as the orange bar above. March came in as a drop of $266B which is very close to the adjusted number. April is only showing one week so far but is positive by $55B. Based on the current trend, this will likely turn negative by the time April data is complete.
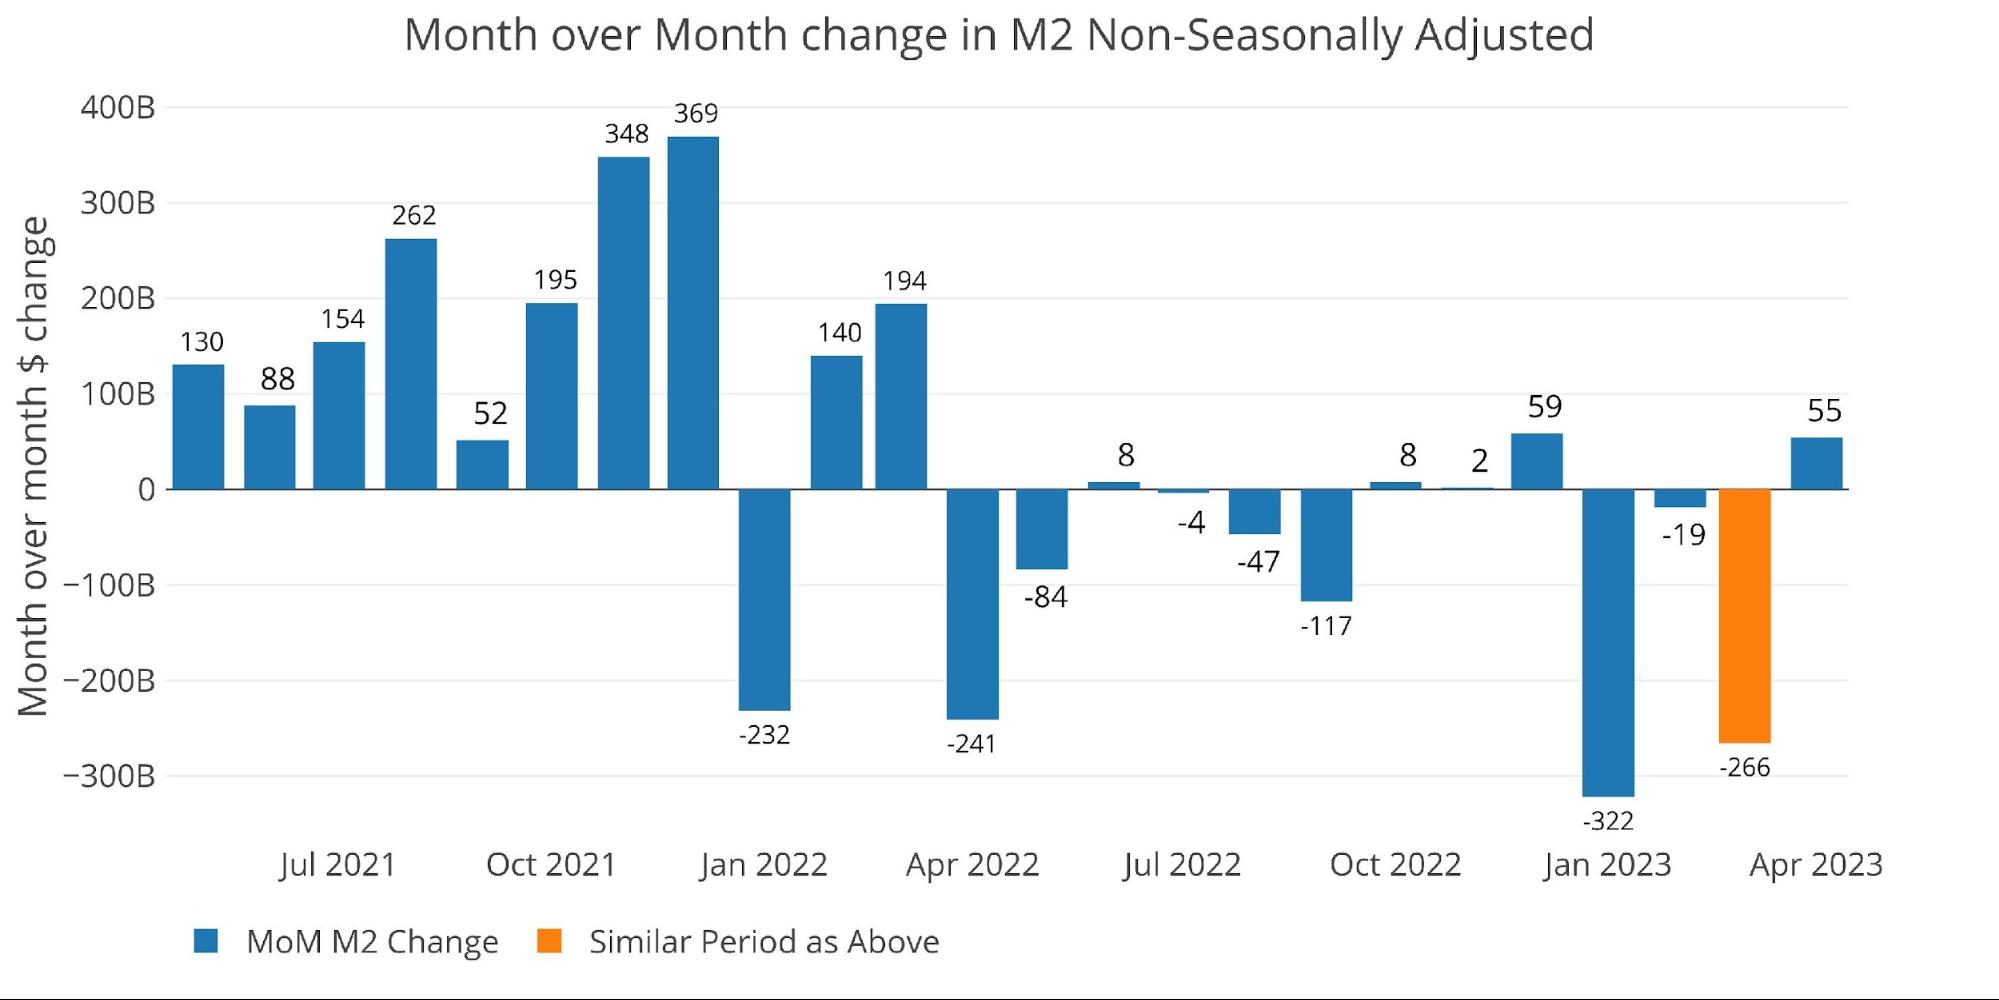
Figure: 2 MoM M2 Change (Non-Seasonally Adjusted)
Looking at the seasonally adjusted numbers shows that this month decreased the Money Supply by an incredible -13.7% annualized which is well below both the 6-month and 12-month trend (-6.4% and -4.1% respectively).

Figure: 3 M2 Growth Rates
The average for March (pre-Covid) was 4.5%, which means this month was below the average by an incredible 1820 bps!
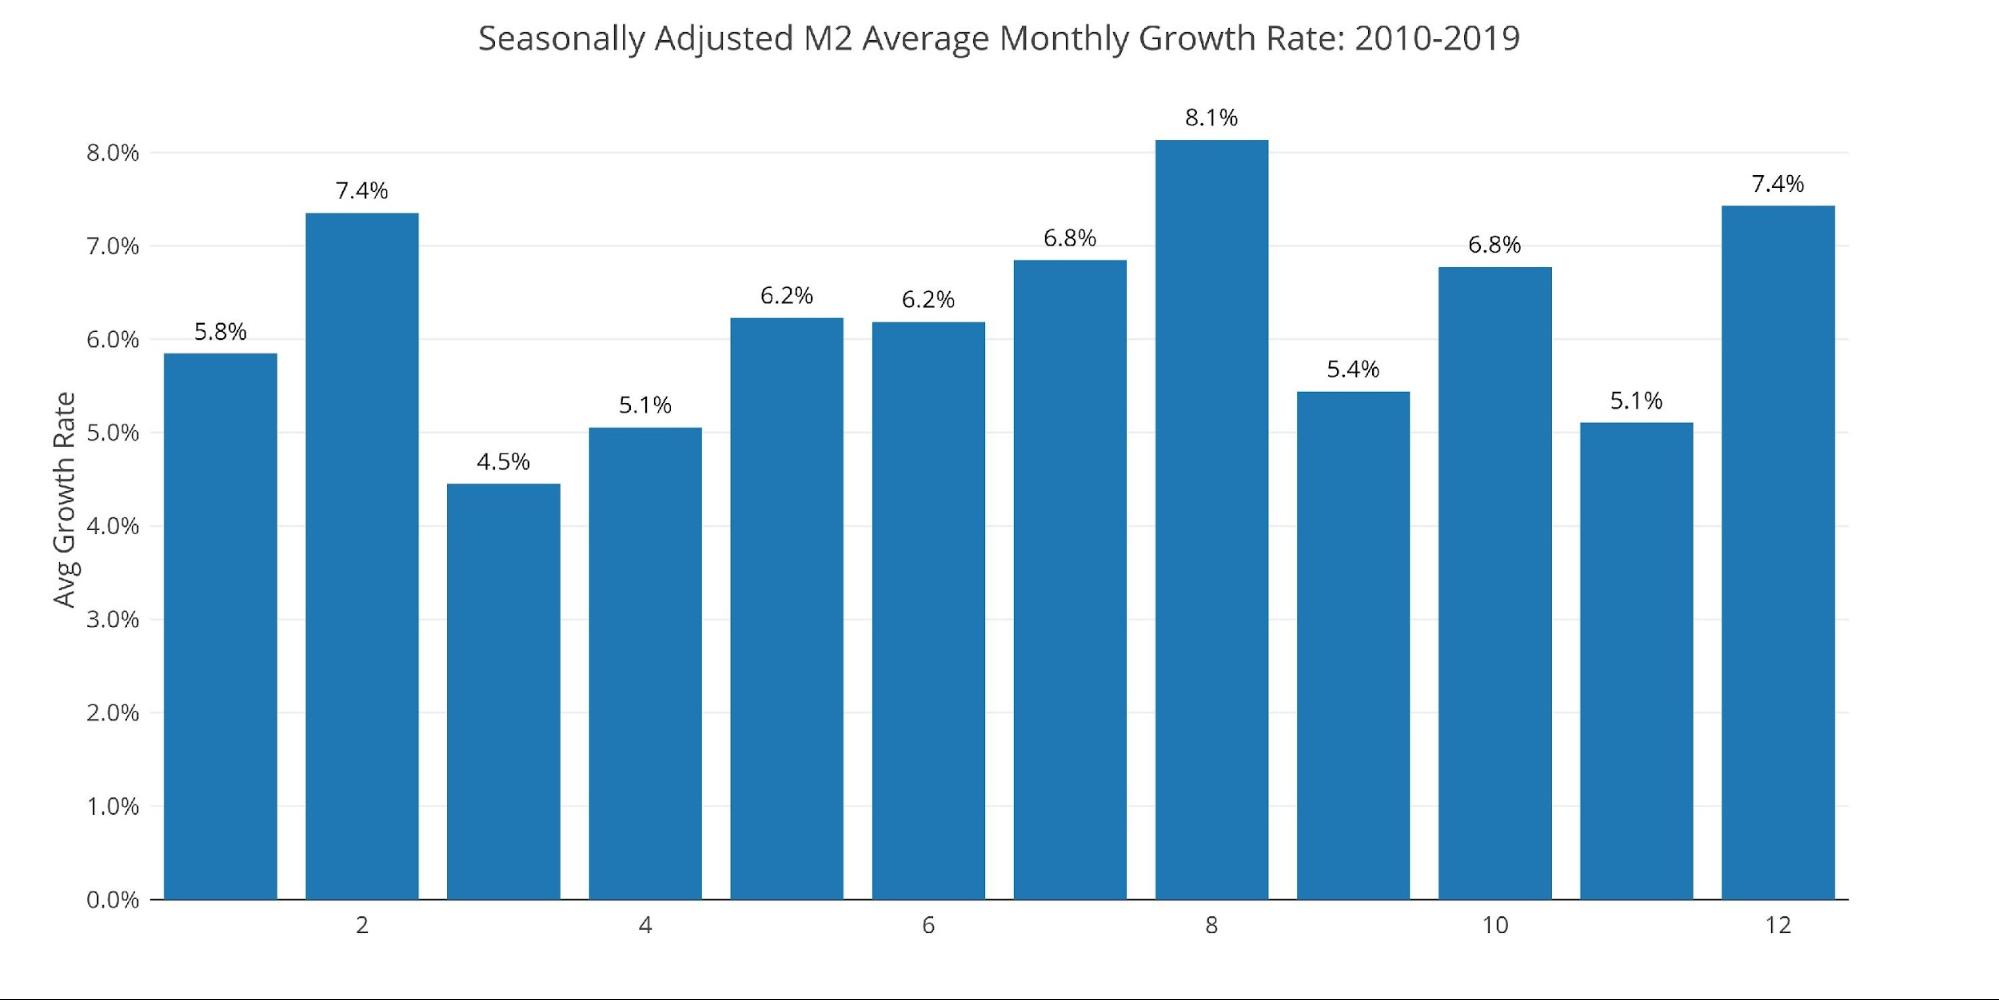
Figure: 4 Average Monthly Growth Rates
The Fed only offers weekly data that is not seasonally adjusted. As the chart below shows, there is a clear trend of the weekly increases being smaller (when they occur) and the weekly decreases being more frequent and much larger on average.
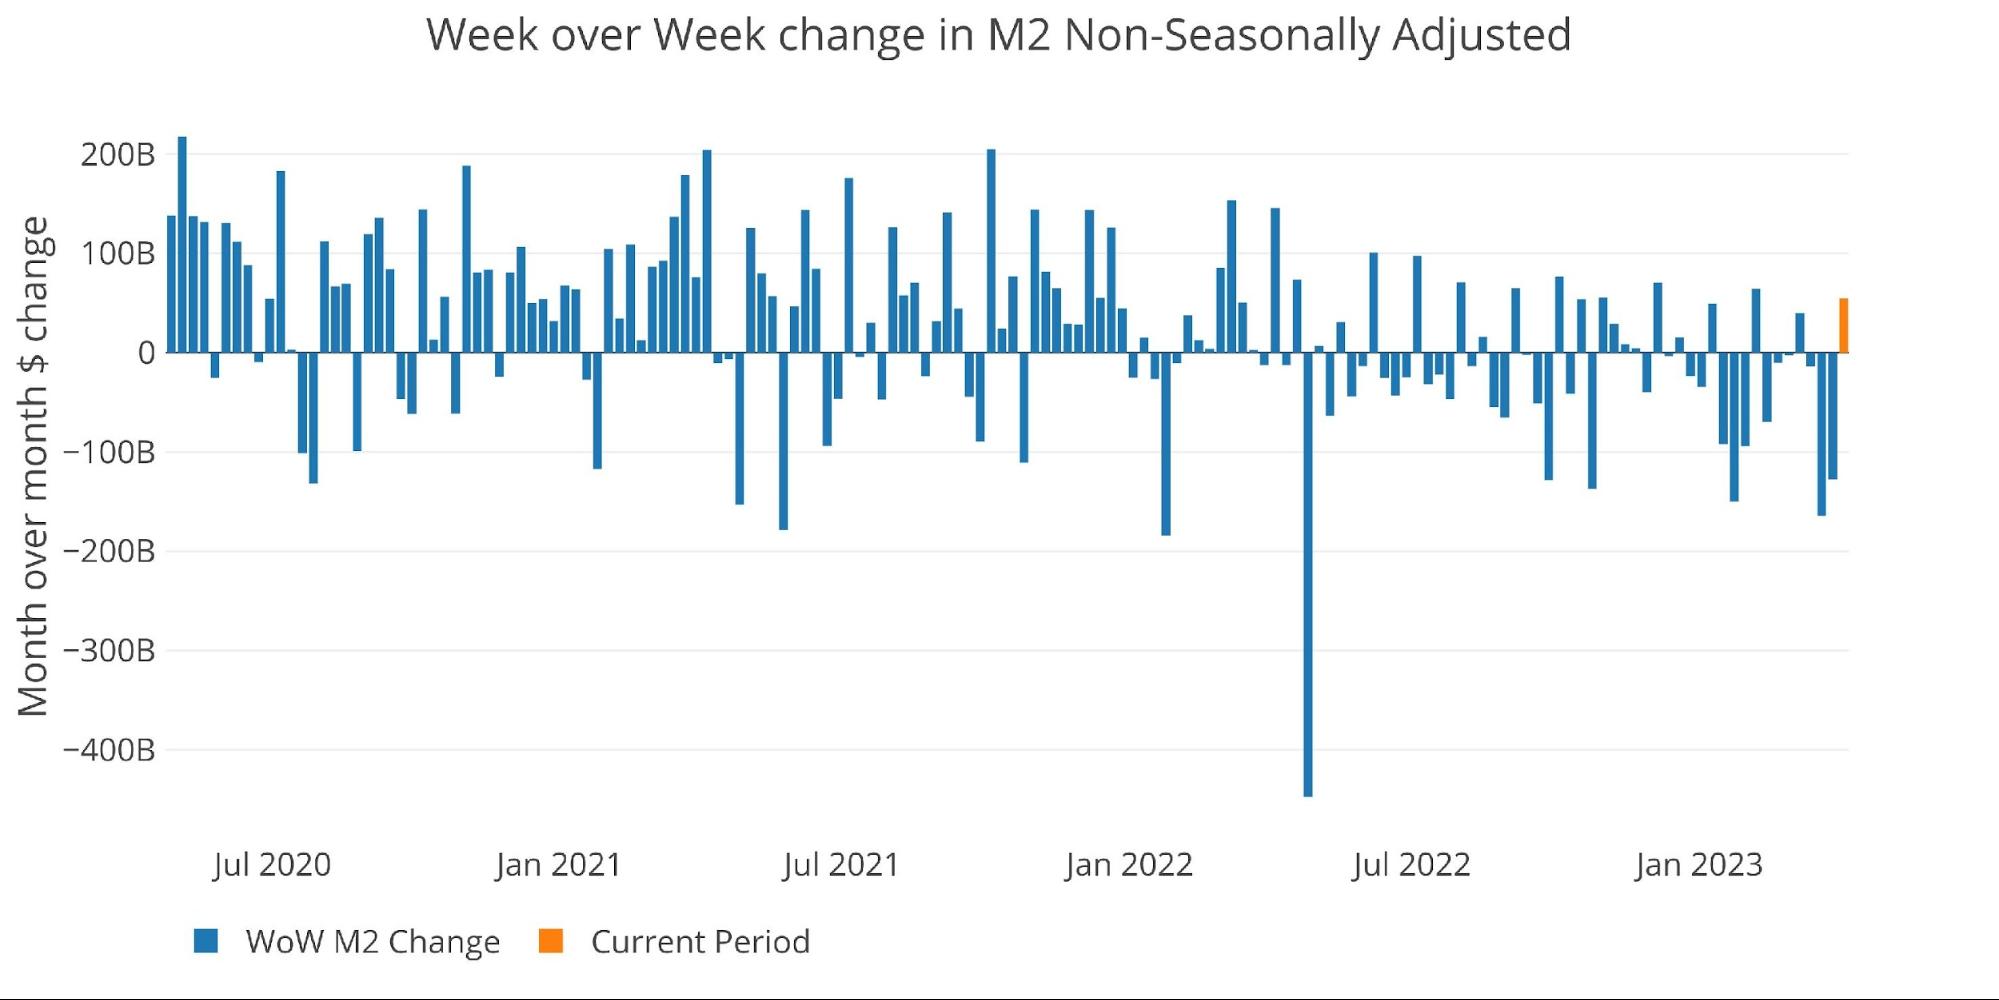
Figure: 5 WoW M2 Change
The “Wenzel” 13-week Money Supply
The late Robert Wenzel of Economic Policy Journal used a modified calculation to track Money Supply. He used a trailing 13-week average growth rate annualized as defined in his book The Fed Flunks. He specifically used the weekly data that was not seasonally adjusted. His analogy was that in order to know what to wear outside, he wants to know the current weather, not temperatures that have been averaged throughout the year.
The objective of the 13-week average is to smooth some of the choppy data without bringing in too much history that could blind someone from seeing what’s in front of them. The 13-week average growth rate can be seen in the table below. Decelerating trends are in red and accelerating trends in green.
The 13-week average has now reached a new all-time low of -5.37%. This is lower than what occurred last August when 13-week Money Supply had crashed to its lowest point ever. That move bottomed at -2.83% while the current down move is at the beginning of the seasonal move down.