by Jan Nieuwenhuijs, The Gold Observer:
 In the hierarchy of money gold is superior to fiat money. From an historical perspective the past decades have been characterized by trust in fiat money, whereby fiat made up the lion share of global international reserves. The war between Russia and Ukraine (and by extension West and East), inflation, and systemic risks are reversing this trend. A long-term gold valuation model, which assumes gold will account for the majority of international reserves, suggests the gold price to exceed $8,000 in the coming decade.
TRUTH LIVES on at https://sgtreport.tv/

The Hierarchy of Money
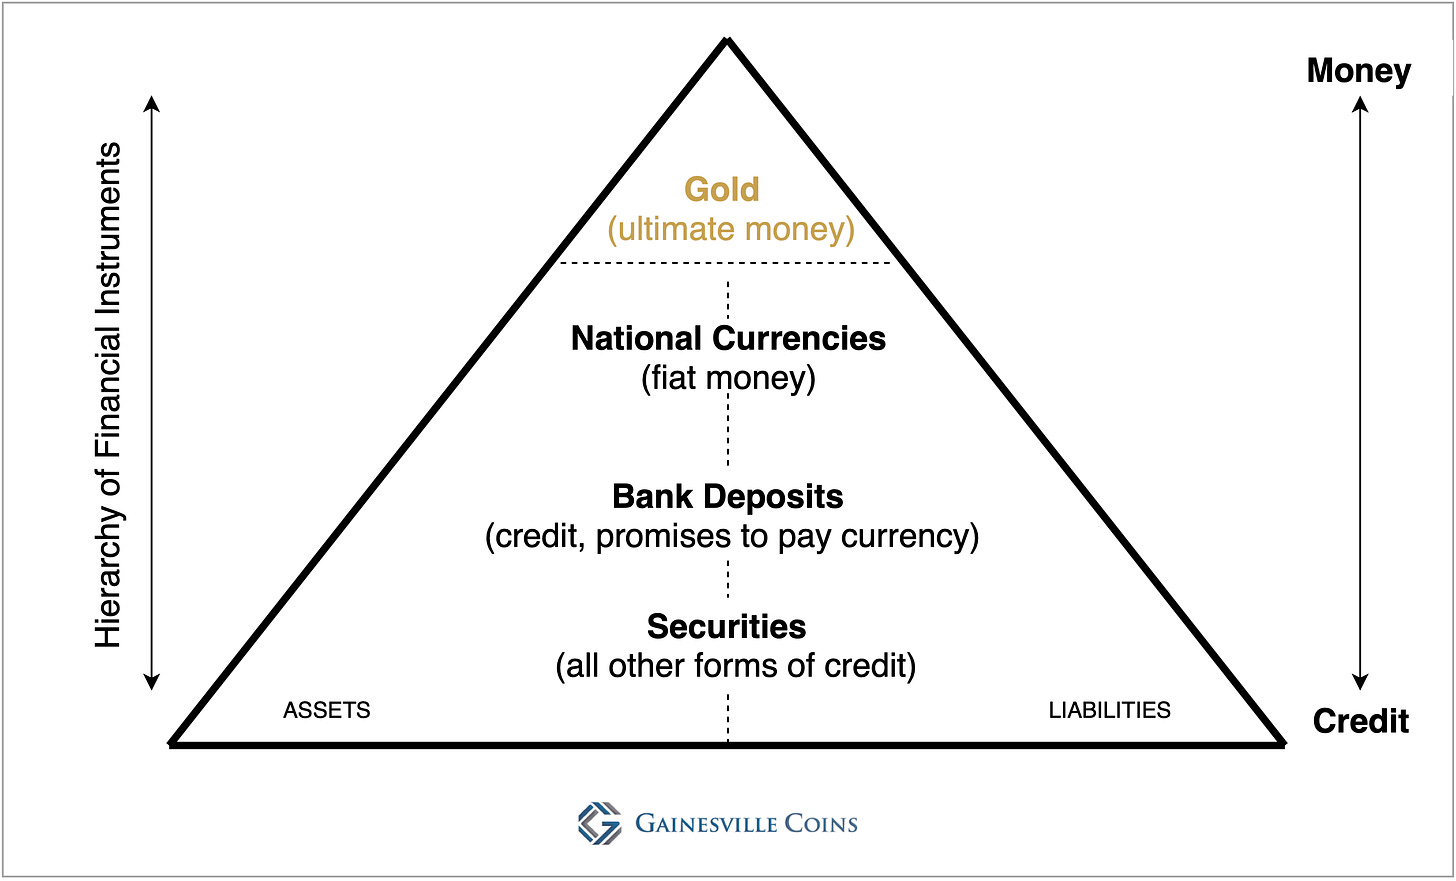
Reading Zoltan Pozsar’s analyses for a few years led me to read books and follow lectures by his intellectual mentor Perry Mehrling, Professor of International Political Economy. According to Mehrling there is a natural hierarchy of money, to be visualized as a pyramid.

At the top of the pyramid sits the ultimate money, which is scarce, universally accepted, and has no counterparty risk because it’s no one’s liability: gold. Below gold are national currencies issued by central banks. Then come deposits that are created by commercial banks. Securities, such as bonds and equity, are at the bottom.
Because everything underneath gold can be created out of thin air, the base of the pyramid can be easily widened. Throughout the business cycle balance sheets (assets and liabilities) are extended—credit is created—causing an economic boom. During a recession, balance sheets contract and the shape of the pyramid is remodeled.
Horizontally, the pyramid is all about quantity and leverage. Vertically, the pyramid is about quality: the higher up the better the quality of money. From Mehrling:
In a boom, credit begins to look like money. Forms of credit become much more liquid, they become much more usable to make payments with. And in contraction, you find out that what you have is not money, it’s credit actually. In a contraction, you find out that gold and currency are not the same thing. That gold is better. You find out that deposits and currency are not the same thing. That currency is better.
Now my interpretation…
A Long-term Gold Valuation Model
What has happened in the past decades, after severing the gold standard in 1971, is a massive increase in supply of fiat money, credit, and securities. The pyramid is out of shape with a tiny tip and a fat debt belly. Global debt to GDP is near its all-time high established in 2020.
Policy makers won’t allow the debt to default—a contraction of credit—because the global financial system has grown too big and intertwined. One default too much could risk the stability of the entire arrangement. The only way to restore the shape of the pyramid is by an increase in the price of gold.
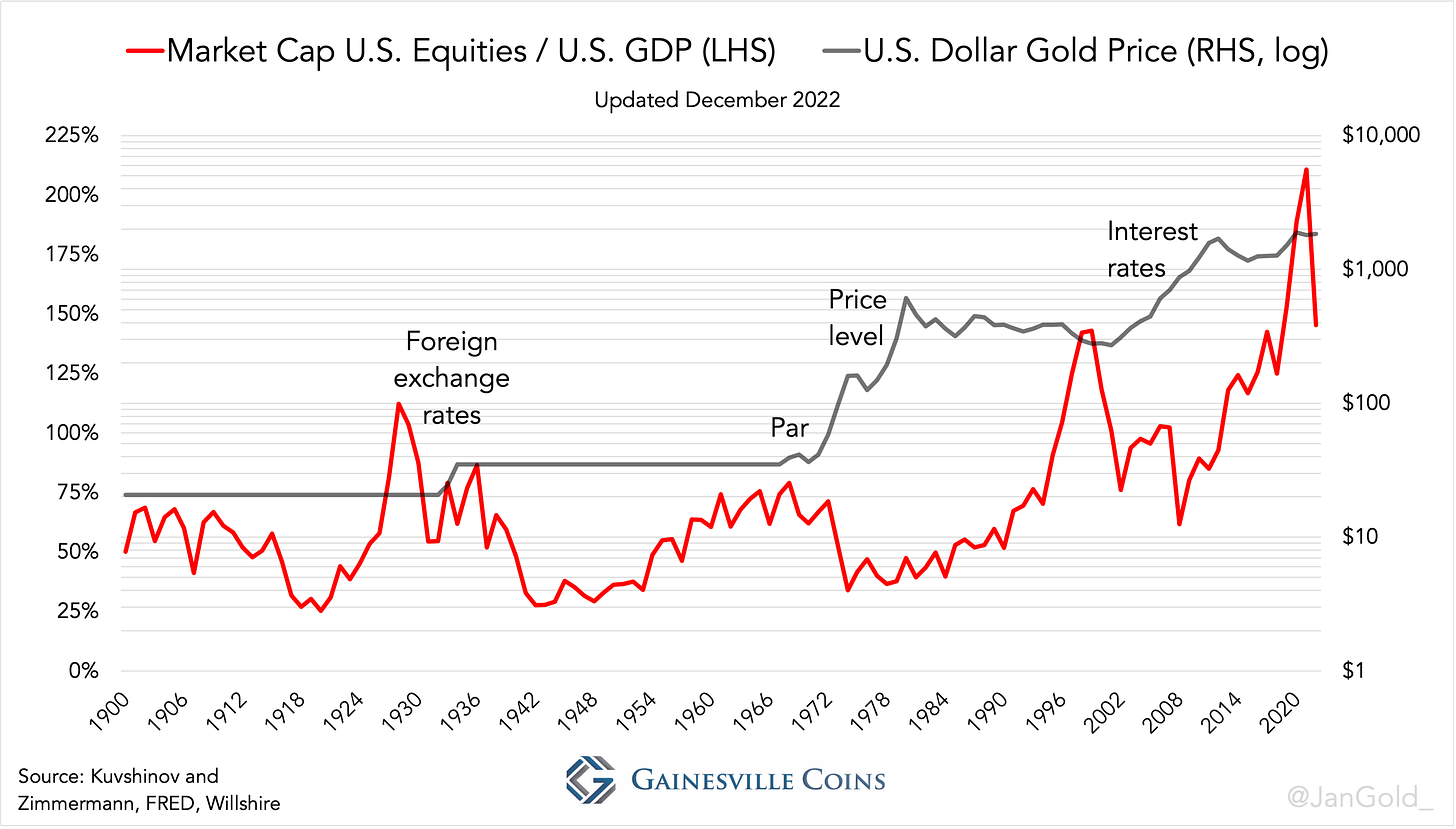
In a previous article we discussed the relationship between the price of gold and equities over the past one hundred years. These are dynamics between the top of the pyramid and the bottom. We concluded that the current decline of the equity market capitalization, relative to GDP, is signaling a new gold bull market.

In today’s article, we will use Mehrling’s hierarchy of money framework, and examine the relationship between national currencies and gold to get a sense of where the price of gold is headed.
Central banks have created so much “money” since 2008 that from an economic perspective the relation with bank deposits has weakened. Measuring the value of official gold reserves versus the monetary base (central bank money) may not satisfy to predict the future price of gold.
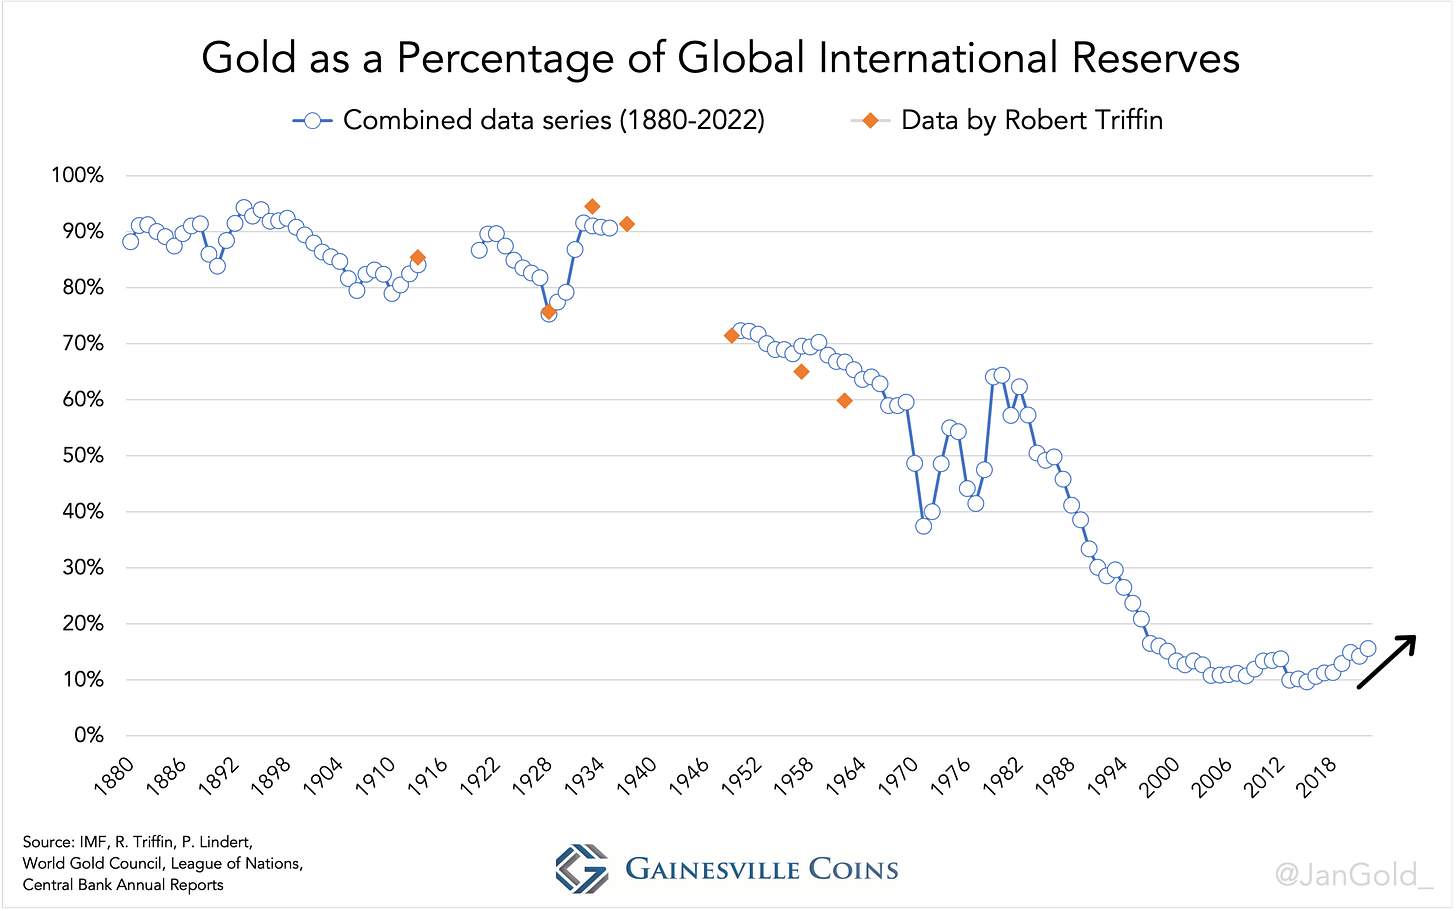
Instead, we will evaluate how much gold central banks are willing to hold relative to foreign national currencies. In other words, the composition of international reserves (foreign exchange and gold), which underpin their balance sheets. By going through the archives, I have been able to conceive a long run data series of gold as a percentage of international reserves from 1880 until present*.

Central banks in aggregate have an unusual faith in foreign exchange, as gold’s percentage of total reserves accounted for 16% in 2022, against a historical average of 59%. These central banks, however, are starting to lose confidence in the currencies issued by their peers. In 2022 official gold reserves went up by a record 1,136 tonnes, while foreign exchange reserves went down by a record $950 billion. Large purchases by central banks on all continents in recent years indicate how central banks think the system will stabilize, by a rising gold price, confirming they have no intention in designing a new pyramid.
Read More @ thegoldobserver.substack.com


