

by Wolf Richter, Wolf Street:
![]() Where is demand for homes supposed to come from when the population keeps dropping like this?
Where is demand for homes supposed to come from when the population keeps dropping like this?
The Census Bureau released its Vintage 2022 population estimates today. I’m going to focus on California, especially the big population centers in Southern California and the San Francisco Bay Area. The big coastal counties lost population, some of them a lot of population. Some inland counties gained population, but not enough, and the State overall lost population.
TRUTH LIVES on at https://sgtreport.tv/
I’m going to look at this with an eye on the housing market because these shifts are already having an impact, with the San Francisco Bay Area being one of the worst housing markets in the country with some of the steepest price declines, and with home prices in coastal southern California also getting hit.
Between April 1, 2020 and July 1, 2022, California’s population dropped by 508,900 people, to 39.03 million, below where the population had been in 2016. The uptick in 2020 was due to the adjustment based on the 2020 Population Census:
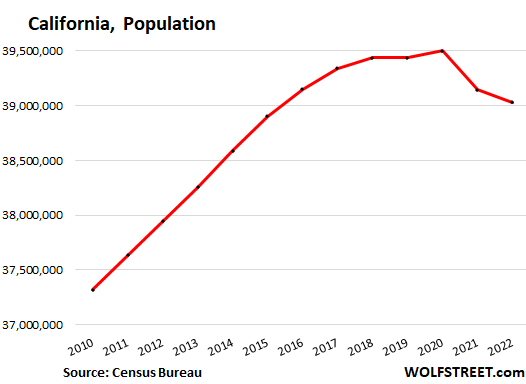
- In the 12 months to July 2022: -113,600
- In the 15 months between April 2020 and July 2021: -395,000
Over these 27 months, the population change is composed of these factors:
- Natural (births minus deaths): +201,500
- Net international migration (in-migration minus out-migration): +171,200
- Net domestic migration (between other states and California): -871,100
Population Decline in the San Francisco Bay Area.
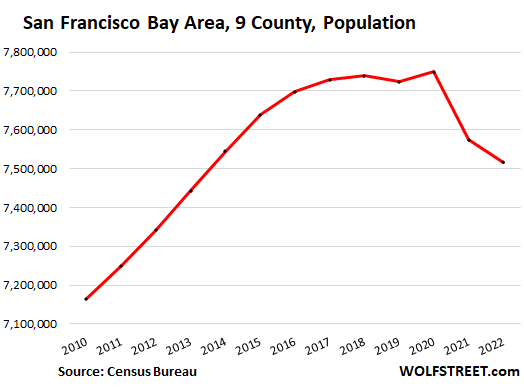
The nine-county San Francisco Bay Area lost 249,400 people over the 27 months between April 1, 2020 and July 1, 2022. The population loss was slower in the 12 months through July 1, 2022, than in the earlier period, but continued.
| Bay Area County | Pop. Loss | Births minus deaths | International net migration | Domestic net migration |
| San Francisco | -65,522 | 2,654 | 7,679 | -70,929 |
| Santa Clara (Silicon Valley) | -65,329 | 17,263 | 25,283 | -105,884 |
| Alameda (East Bay) | -53,334 | 12,682 | 16,030 | -80,712 |
| San Mateo (Silicon Valley) | -35,251 | 5,250 | 6,494 | -46,010 |
| Contra Costa (East Bay) | -8,961 | 5,940 | 6,555 | -22,397 |
| Marin (North Bay) | -6,300 | -36 | 1,299 | -7,594 |
| Sonoma (Wine Country) | -6,225 | -293 | 832 | -6,612 |
| Solano | -4,743 | 2,091 | 1,199 | -8,047 |
| Napa (Wine Country) | -3,724 | -290 | 187 | -3,653 |
| Total: | -249,389 | 45,261 | 65,558 | -351,838 |
The nine-county Bay Area population overall declined by 3.3% from the peak in 2020, to 7.516 million, which is below where it had first been in 2014. In the chart, the uptick in 2020 is due to the population adjustment following the Census of 2020:
The two biggest population losers in the Bay Area.
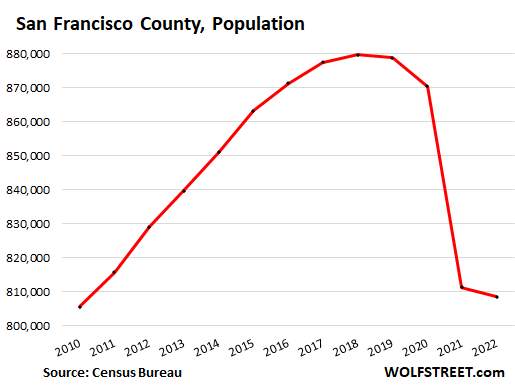
San Francisco’s population plunged by 8.1% from the peak in 2018 to 808,400 in mid-2022, below where it had been in 2012.
The city has experienced crazy boomtown years through 2019, with big price increases, enormous congestion, much hyped office shortages and apartment shortages, which then turned into gluts, as the boomtown craziness faded. But it’s still congested and expensive, and getting into your favorite restaurants can still be tough, but home prices are down a lot, by every measure.
The exodus slowed over the 12 months through July 1, 2022. But this population snapshot does not yet include the large-scale layoffs and hiring freezes in tech and social media that have hit the City since then:
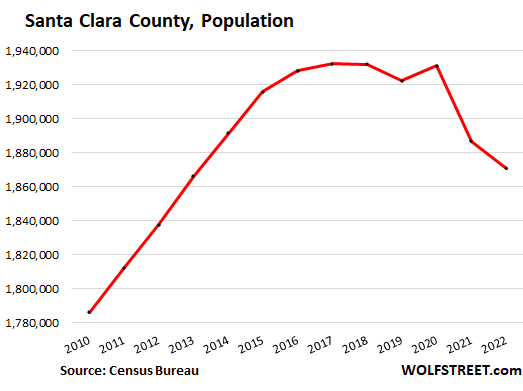
Santa Clara County’s population dropped by 3.2%, from 2020 to 1.871 million in 2022, below where it had been in 2014. The county includes the southern part of Silicon Valley and the city of San Jose. As in San Francisco, this population snapshot does not yet include the effects of the layoffs in tech and social media since mid-2022:
Population Decline in Coastal Southern California.
The big four coastal counties of Southern California have lost population from April 2020 to July 1, 2022. Combined, they have lost 362,400 people:
| County | Pop. Change | Births minus deaths | International net migration | Domestic net migration |
| Los Angeles | -292,904 | 30,731 | 46,198 | -363,760 |
| Orange | -35,795 | 13,976 | 14,840 | -64,611 |
| San Diego | -22,427 | 25,205 | 11,908 | -58,429 |
| Ventura | -11,238 | 3,257 | 1,039 | -15,991 |
| Total: | -362,364 | 73,169 | 73,985 | -502,791 |
But the population of the combined four counties peaked in 2017 and then began dropping, led by Los Angeles County. By July 2022, the population dropped by 452,700, or by 2.6%:
From their respective peaks:
- Los Angeles: -3.7%
- San Diego: -1.7%
- Ventura: -1.3%
- Orange: -1.1%