

by Igor Chudov, Global Research:

SUMMARY: UKHSA’s report shows that instead of “protecting” people from Covid-19, Covid vaccines significantly increase the risk of hospitalization in months 7-9 after vaccination. publishes regular “vaccine effectiveness reports.”
The reports were designed to have several statistical sections meant to highlight vaccine successes. Funnily, many sections had to be discontinued as “vaccine successes” turned into spectacular failures. This happened with case and death rates and the section about pregnancies, which has not been updated for months but shows a 15% drop in UK pregnancies year-on-year.
However, another section of the report allows us to see something interesting. Look at the latest Vaccine Surveillance Report for Week 5, 2023. It shows hospitalization rates for various ages based on how long ago was their last dose. The rates apply to January 2023, which is the most recent data.
TRUTH LIVES on at https://sgtreport.tv/
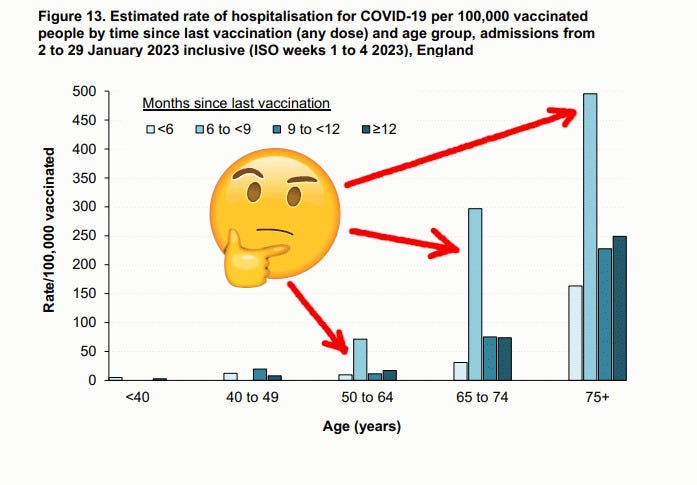
The most important fact we see is that for people over 50, the most dangerous period after vaccination is between 6 and 9 months after their last dose.
Their risk of hospitalization is several times higher than before six months or after nine months. The increase in risk far outweighs a small reduction in the first six months.
As a side note, this chart shows that additional boosters outright do not reduce risks for people under 50. However, those have very few hospitalizations, making the data less reliable for those ages.
So, people who take a Covid booster first go through a somewhat reduced hospitalization risk for the first six months, then go through a dramatically heightened risk of hospitalization, then hospitalization rates “return to normal,” with the normal being very high. Does that look like the vaccine provides any benefit? Not to me!
Consider, for example, the 65-74 age group. According to the above chart, for those 6-9 months after vaccination, the hospitalization rate is about 300 per 100,000 for just one month of exposure (this January). This means one out of three hundred Brits aged 65-74 who were 6-9 months after their last booster, was hospitalized for Covid this January.
The hospitalization rate of 300 per 100,000 is enormous!
The last time UKHSA reported hospitalization rates per 100,000 was in week 13 2022 report. (, which showed hospitalization rates for similar age groups (also for a four week period) (click UKSA Report, Table 14, page 45):
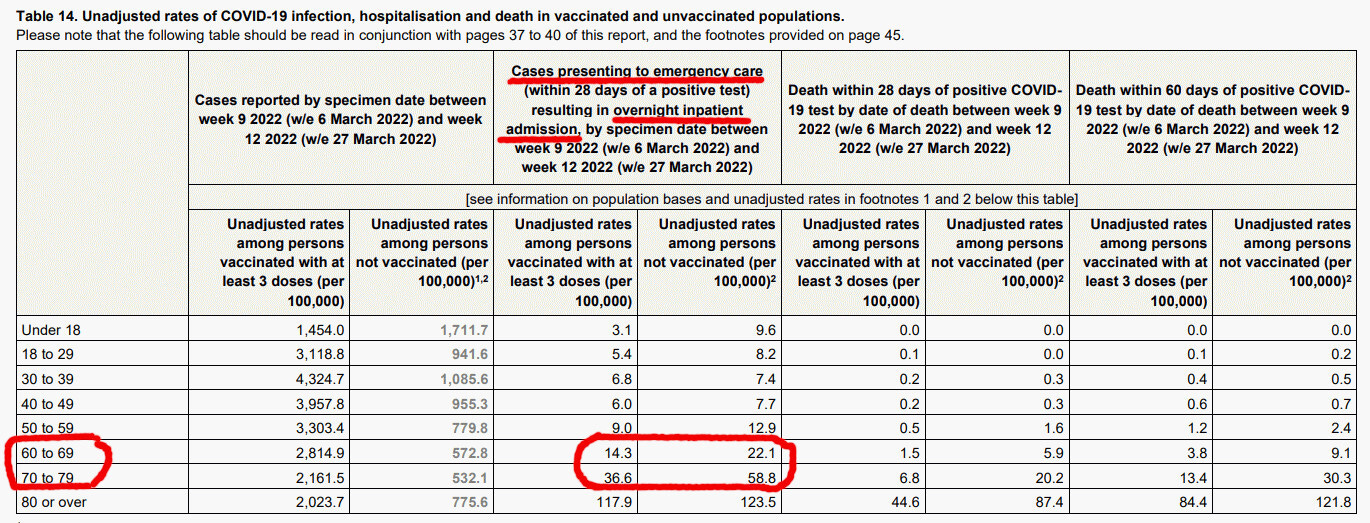
The age groups do not exactly match, but you can see that vaccinated people 65-75 years old had a roughly 25 per 100,000 hospitalization rate last March. In contrast, unvaccinated people’s hospitalization rate was about 40 per 100,000 during that period.
Now, people 6-9 months after vaccination have 300 per 100,000 or about 8-10 times greater hospitalization rates than they would have last March.
While the numbers are not directly comparable, their disparity is enormous. It should raise questions about what is going on with vaccines and why they enhance COVID hospitalization rates so much, at a certain time after the last dose.
The overall higher hospitalization rates for all ages suggest that Covid was more severe this January, compared to last March. Again, while being mindful that age groups do not match, you can compare rates on the January 2023 Figure 13 chart with those in the March 2022 table 14. Hospitalization rates per 100,000 for vaccinated people in all age groups seem to have increased by about three times.
Mind you, there were more Covid cases last March than this January, according to the British Covid-counting app Zoe, which is based on symptoms recorded by the Zoe app users, not on official tests:
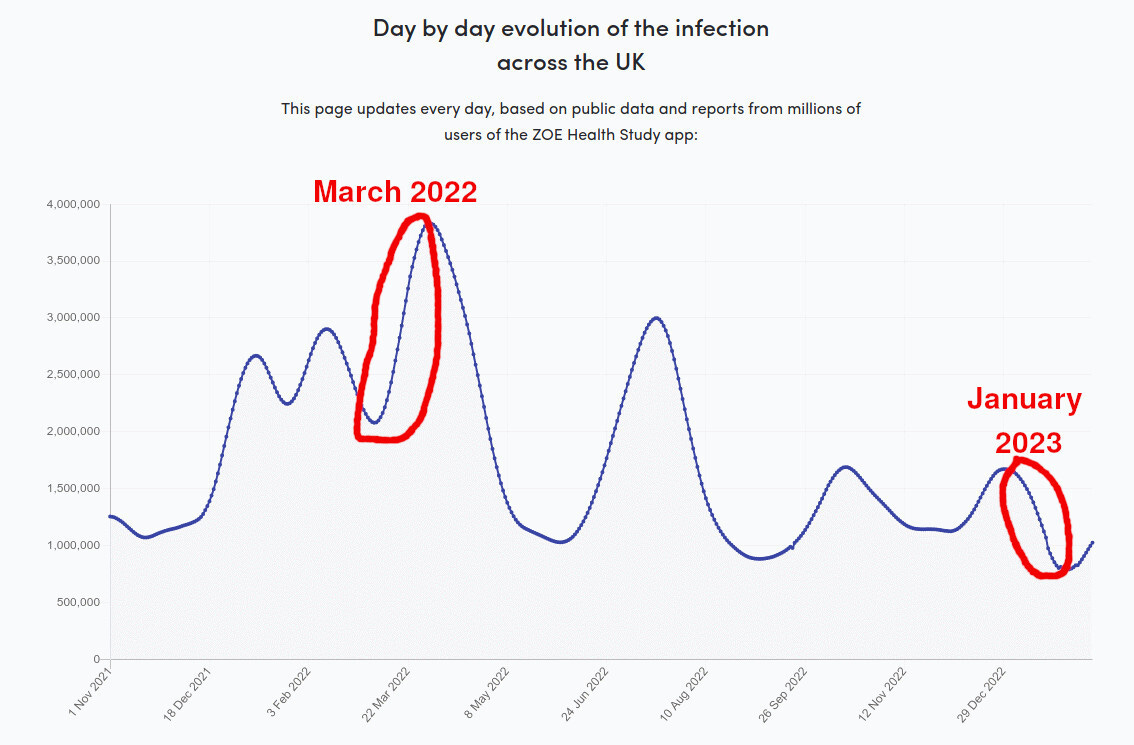
So,
- there were about half as many Covid infections this January compared to the last March, but
- the hospitalization rates per 100,000 population for January were about three times greater,
- This suggests 3/0.5 = six times greater disease virulence (a rough estimate).
Does this six times greater virulence represent Covid becoming more intrinsically severe (the Geert variant), or are vaccines and/or reinfections contributing to enhanced mortality, perhaps via the IgG4 mechanism? We cannot tell that from these charts.
Some possibilities are discussed here.
I believe we are getting closer to getting answers about what is going on with mortality, as the data coming out narrows the range of possibilities.
What do you think causes all this worsening? Vaccines, new variants, reinfections, or all of the above?
