

by Alasdair Macleod, GoldMoney:

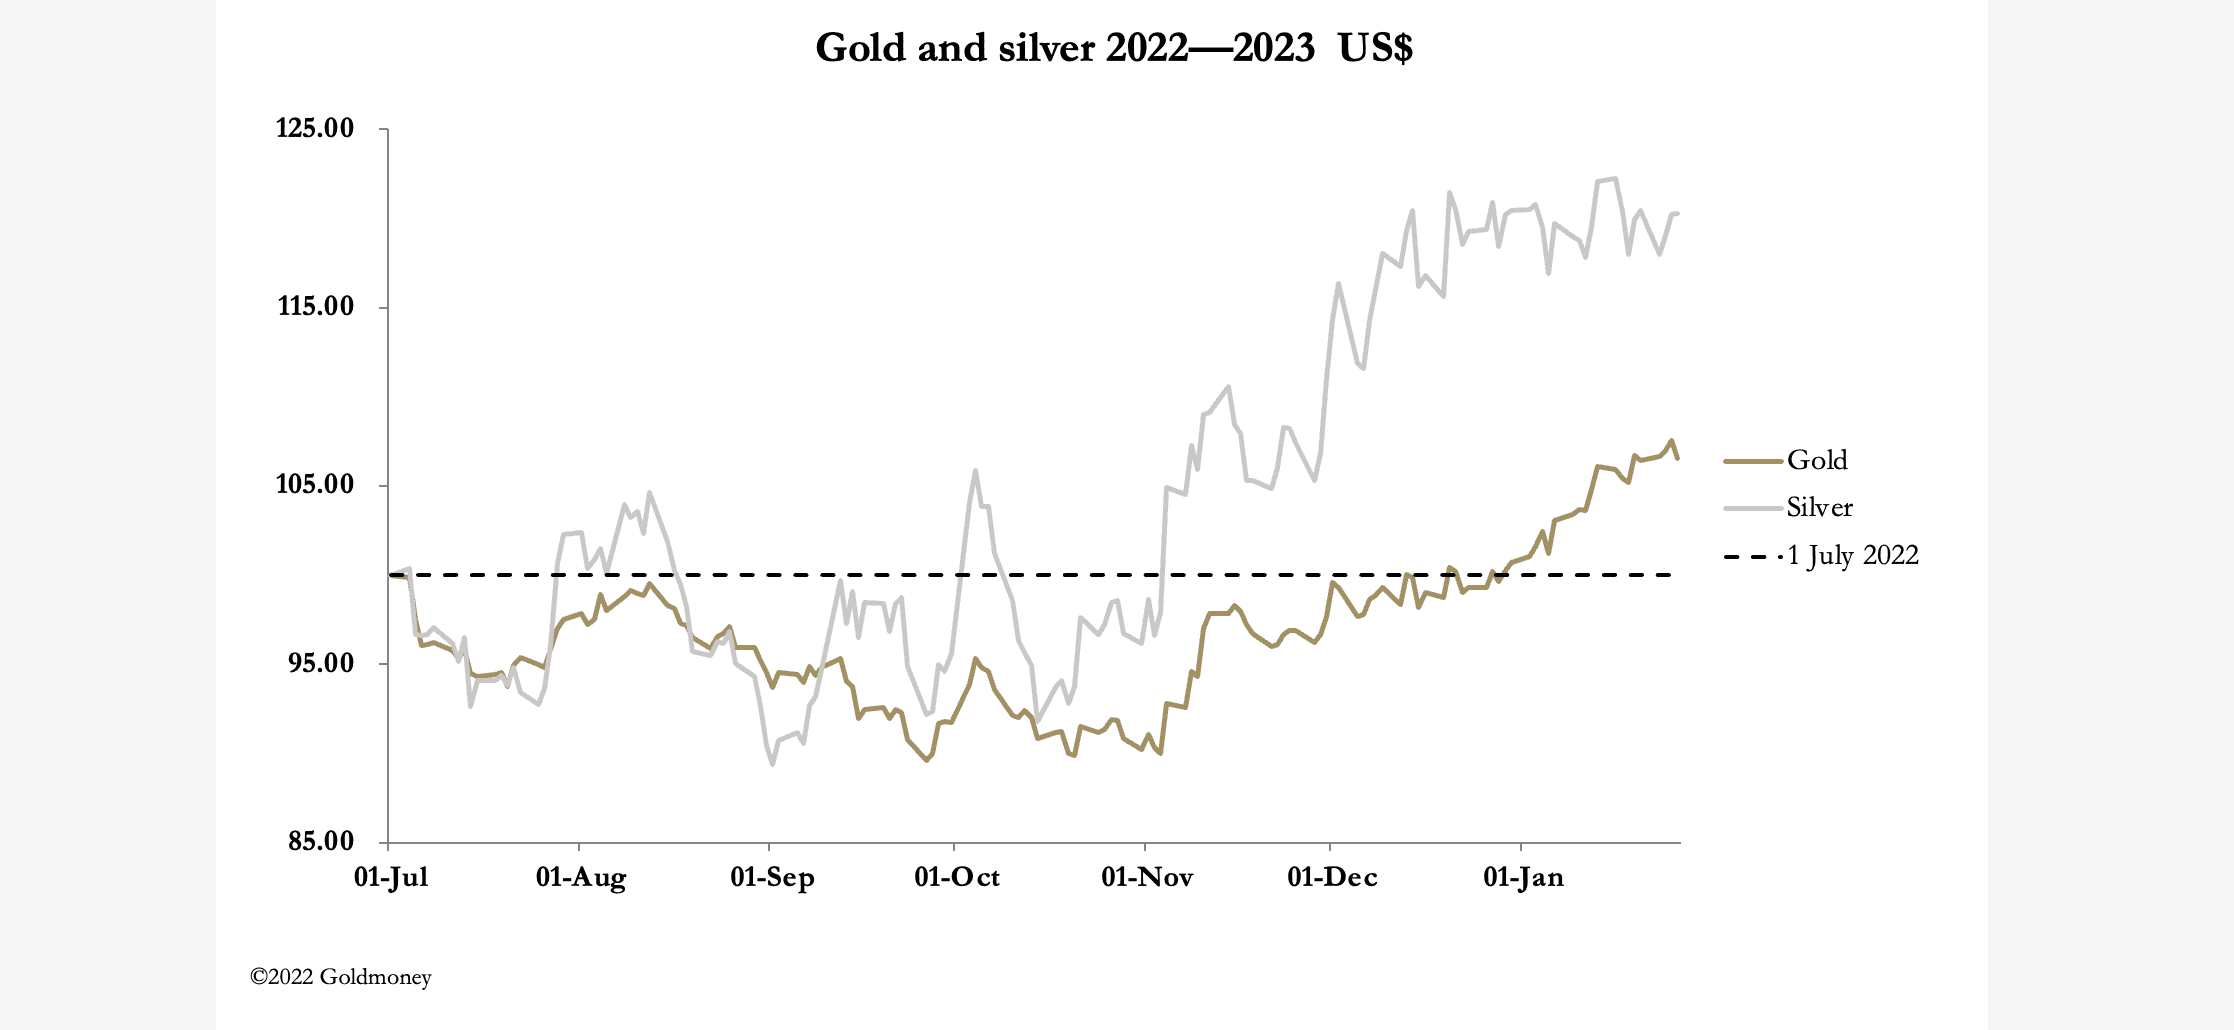
This week, gold and silver further consolidated their gains since last September, with gold showing a continuing upward bias. Silver is tracking sideways, as our headline chart shows. In European trade this morning, gold was $1928, up only $3, while silver was $23.70, down 20 cents. Comex turnover in both metals was healthy, with Open Interest rising noticeably, but both levels are still moderate.
TRUTH LIVES on at https://sgtreport.tv/
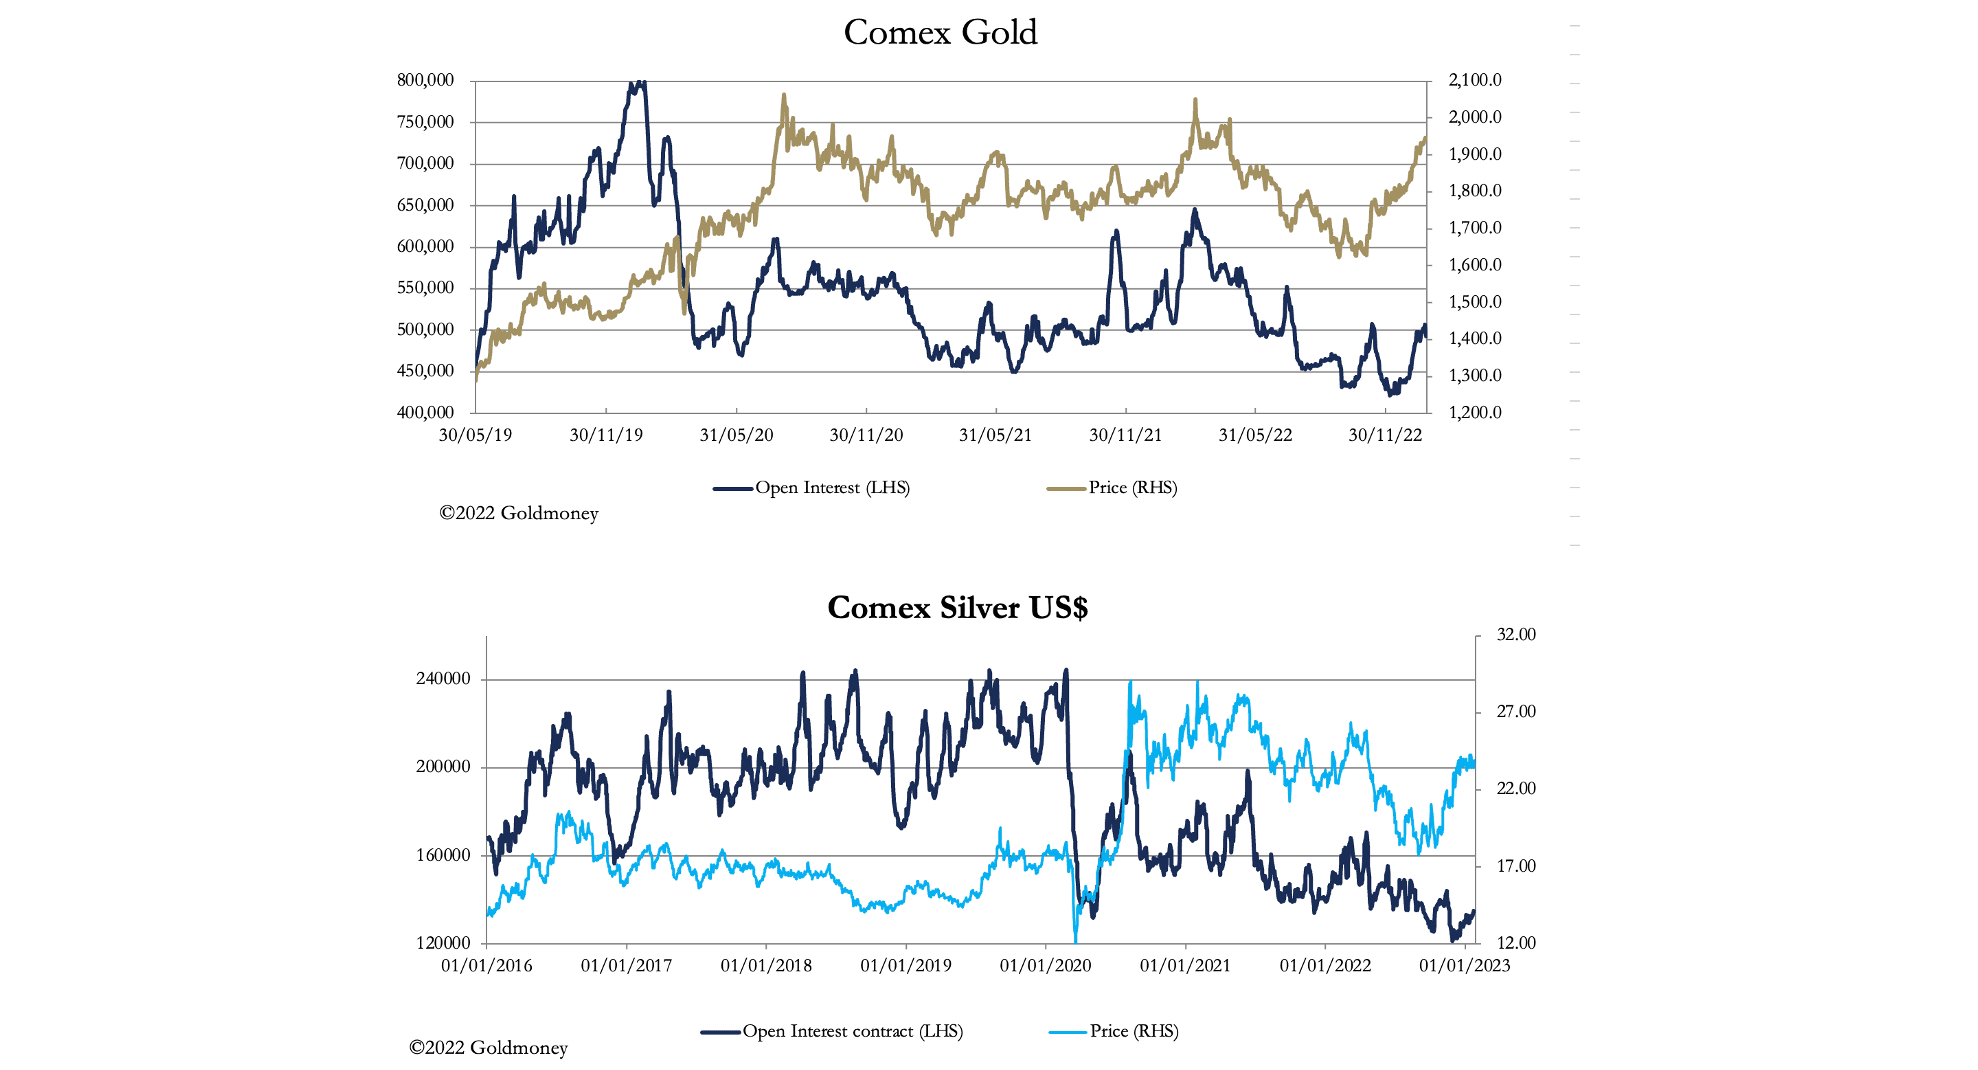
The chart for silver is interesting, because a rise in Open Interest of less than 14,000 contracts since November has led to a rise of 13.5% in the price. And with the gold/silver ratio now at 81.2, there is substantial upside potential in the price, assuming the underlying bull trend resumes.
Let’s look at gold’s Open Interest in more detail, which is up next.

The increase in the gold price since early-December has had technical analysts claiming that gold is overbought short-term and is overdue a consolidation, but Open Interest shows that gold is still generally oversold. The technical chart is next.
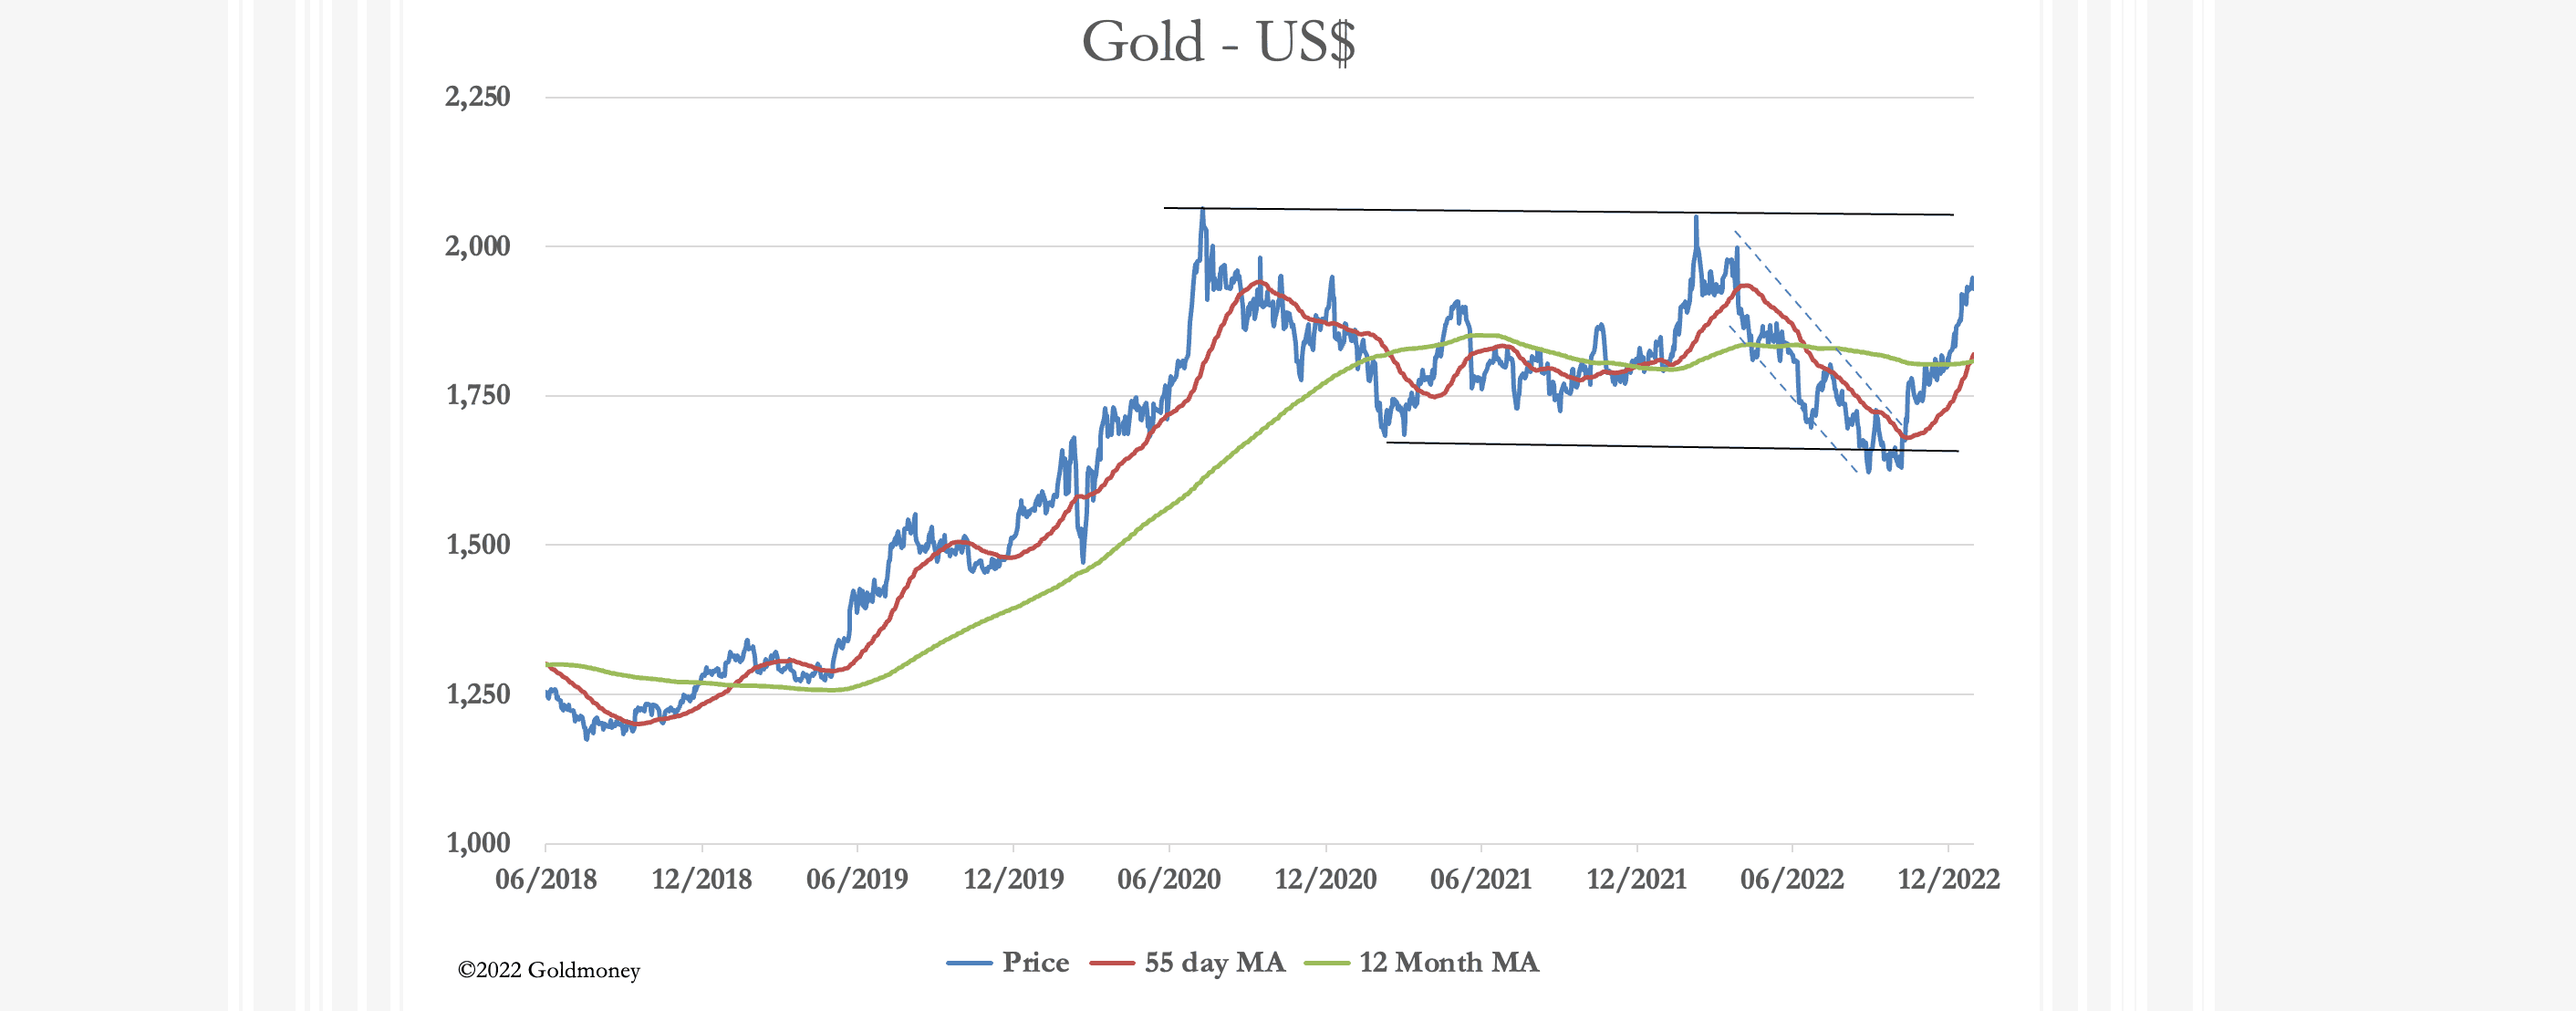
While a move back down to a very bullish golden cross at $1810 cannot be ruled out, the momentum under the gold price in the chart is very impressive, and to sell hoping to buy gold back at lower prices looks risky. Furthermore, it should be pointed out that the gold price is of derivative paper contracts and ignores underlying physical liquidity.
Evidence of who is buying physical bullion is always sketchy. The only visibility is in Comex deliveries and ETF demand. The January gold contract is regarded as a non-delivery month, yet 5,749 contracts have been stood for delivery, representing 574,900 ounces (17.9 tonnes). On a monthly basis, ETF demand declined further in December, but according to the World Gold Council the pace of this decline has been slowing. And we can expect an increase in ETF demand to end-January, given the correlation between the price and demand. This is our next chart.

We know from anecdotal evidence that demand for physical bullion is absorbing all supply. Central banks have been adding to their official reserves, and China reportedly bought between 250‑300 tonnes in November/December last year.
Asian central banks and their governments appear to be the principal buyers. Furthermore, before Russia was sanctioned, all her annual output of 330 tonnes was sold into London, and that supply source has now ceased. Russia is now aggressively accumulating gold, and according to President Putin’s chief economist, production is being ramped up to 500 tonnes. The same man, Sergey Glazyev, has revealed that in future Russia will settle its trade balances in gold, and that he expects all members, associates, and dialog partners of the Shanghai Cooperation Organisation to do so as well. That is why these governments are building their bullion holdings.
