by Peter Schiff, Schiff Gold:

The Federal Government ran a deficit of -$85B in December. While this was much smaller than the deficit posted in November, it marks one of the largest December deficits ever.
As the chart below shows, the month of December is usually a small deficit month with 2020 and the Great Financial Crisis being the exceptions. For example, the last four December deficits have been -$13B, -$143, -$21B, and -$85B (2022).
TRUTH LIVES on at https://sgtreport.tv/

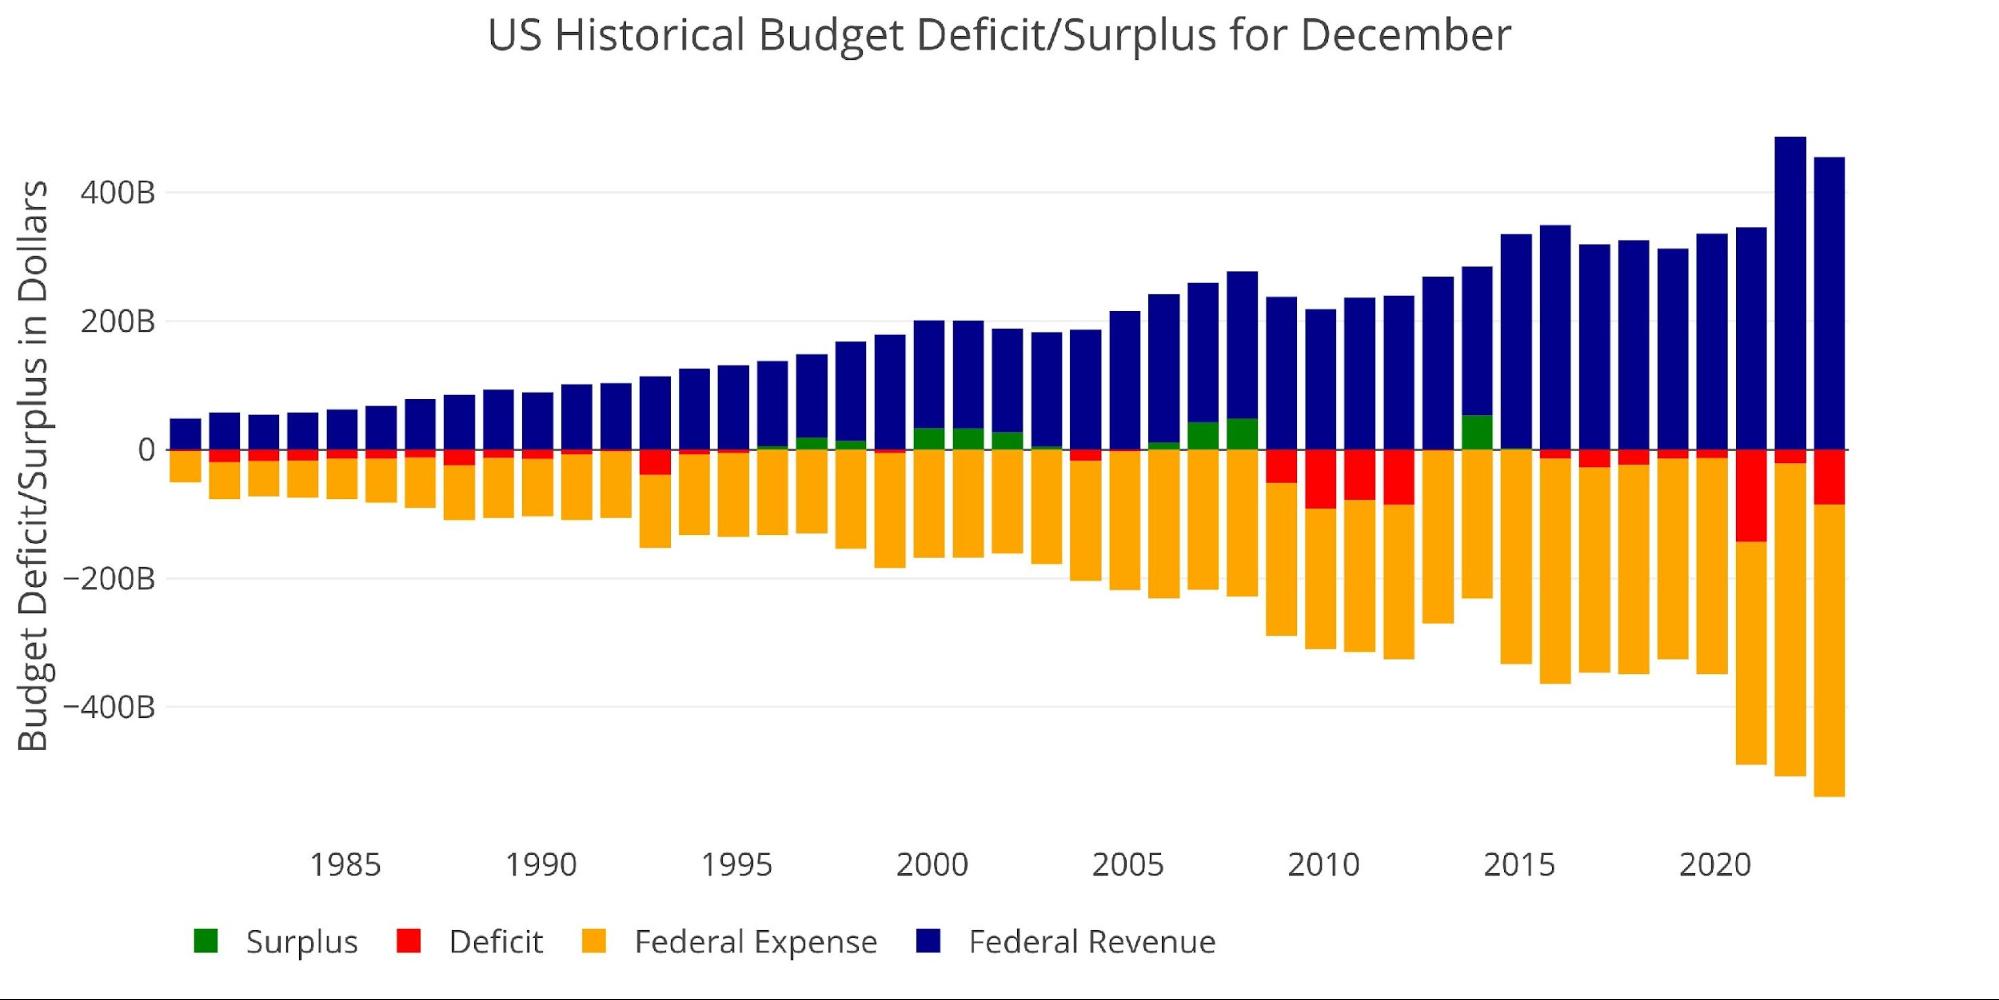
Figure: 2 Historical Deficit/Surplus for December
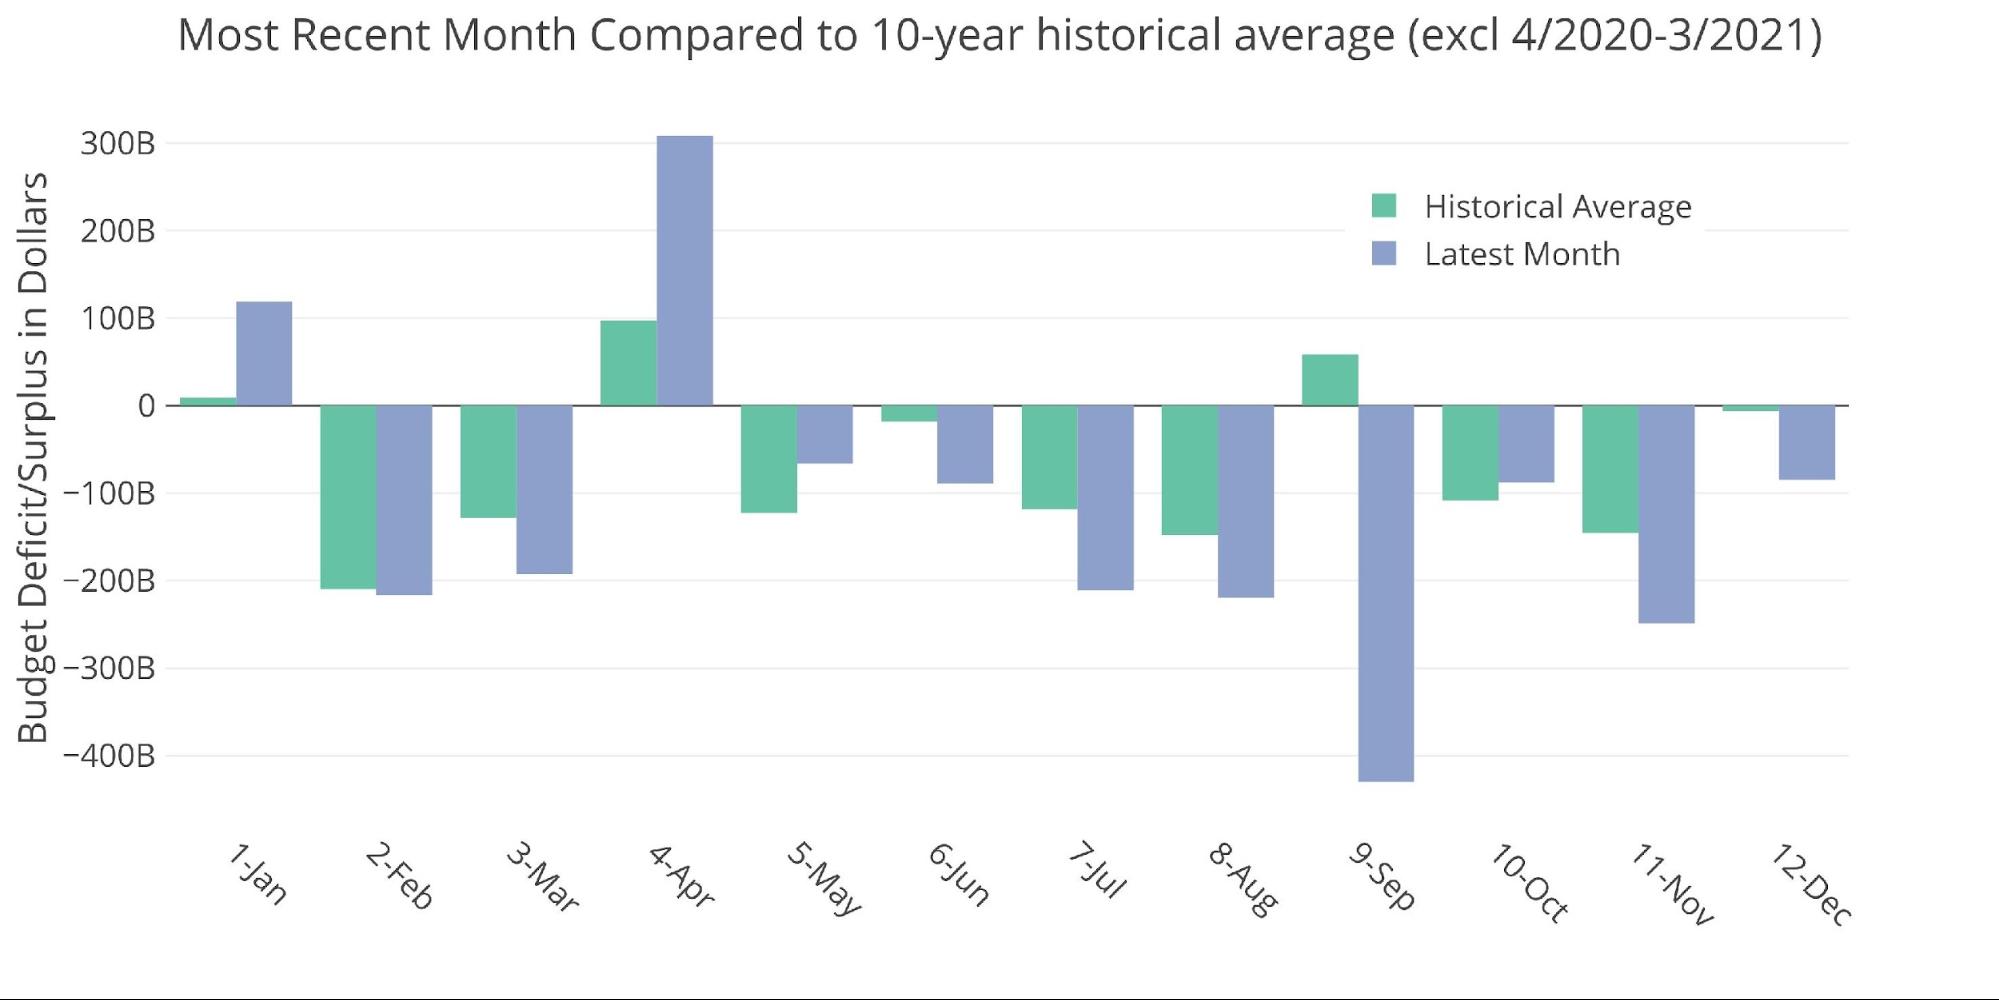
For the decade before Covid, December averaged a deficit of -/$6.5B which makes this December 13x larger than the historic average.
Figure: 3 Current vs Historical
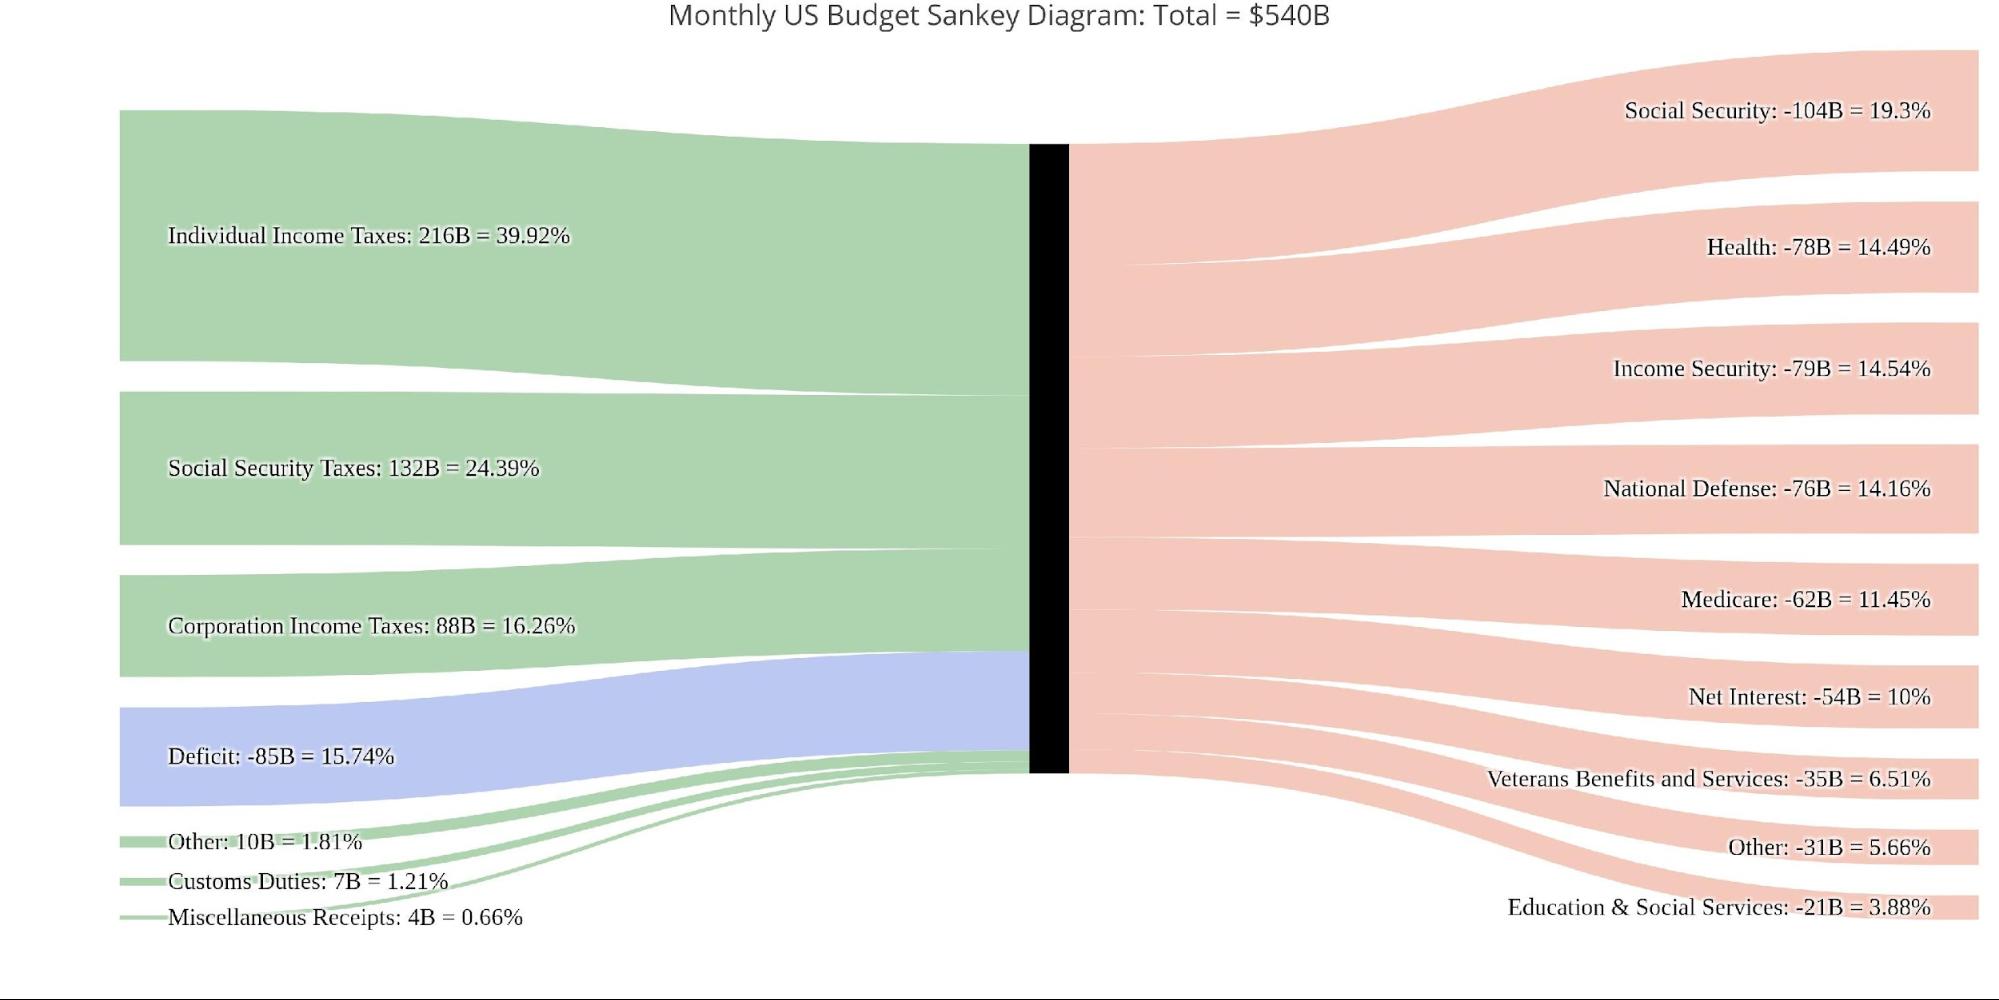
The Sankey diagram below shows the distribution of spending and revenue. The Deficit represented 15.7% of total spending.
Figure: 4 Monthly Federal Budget Sankey
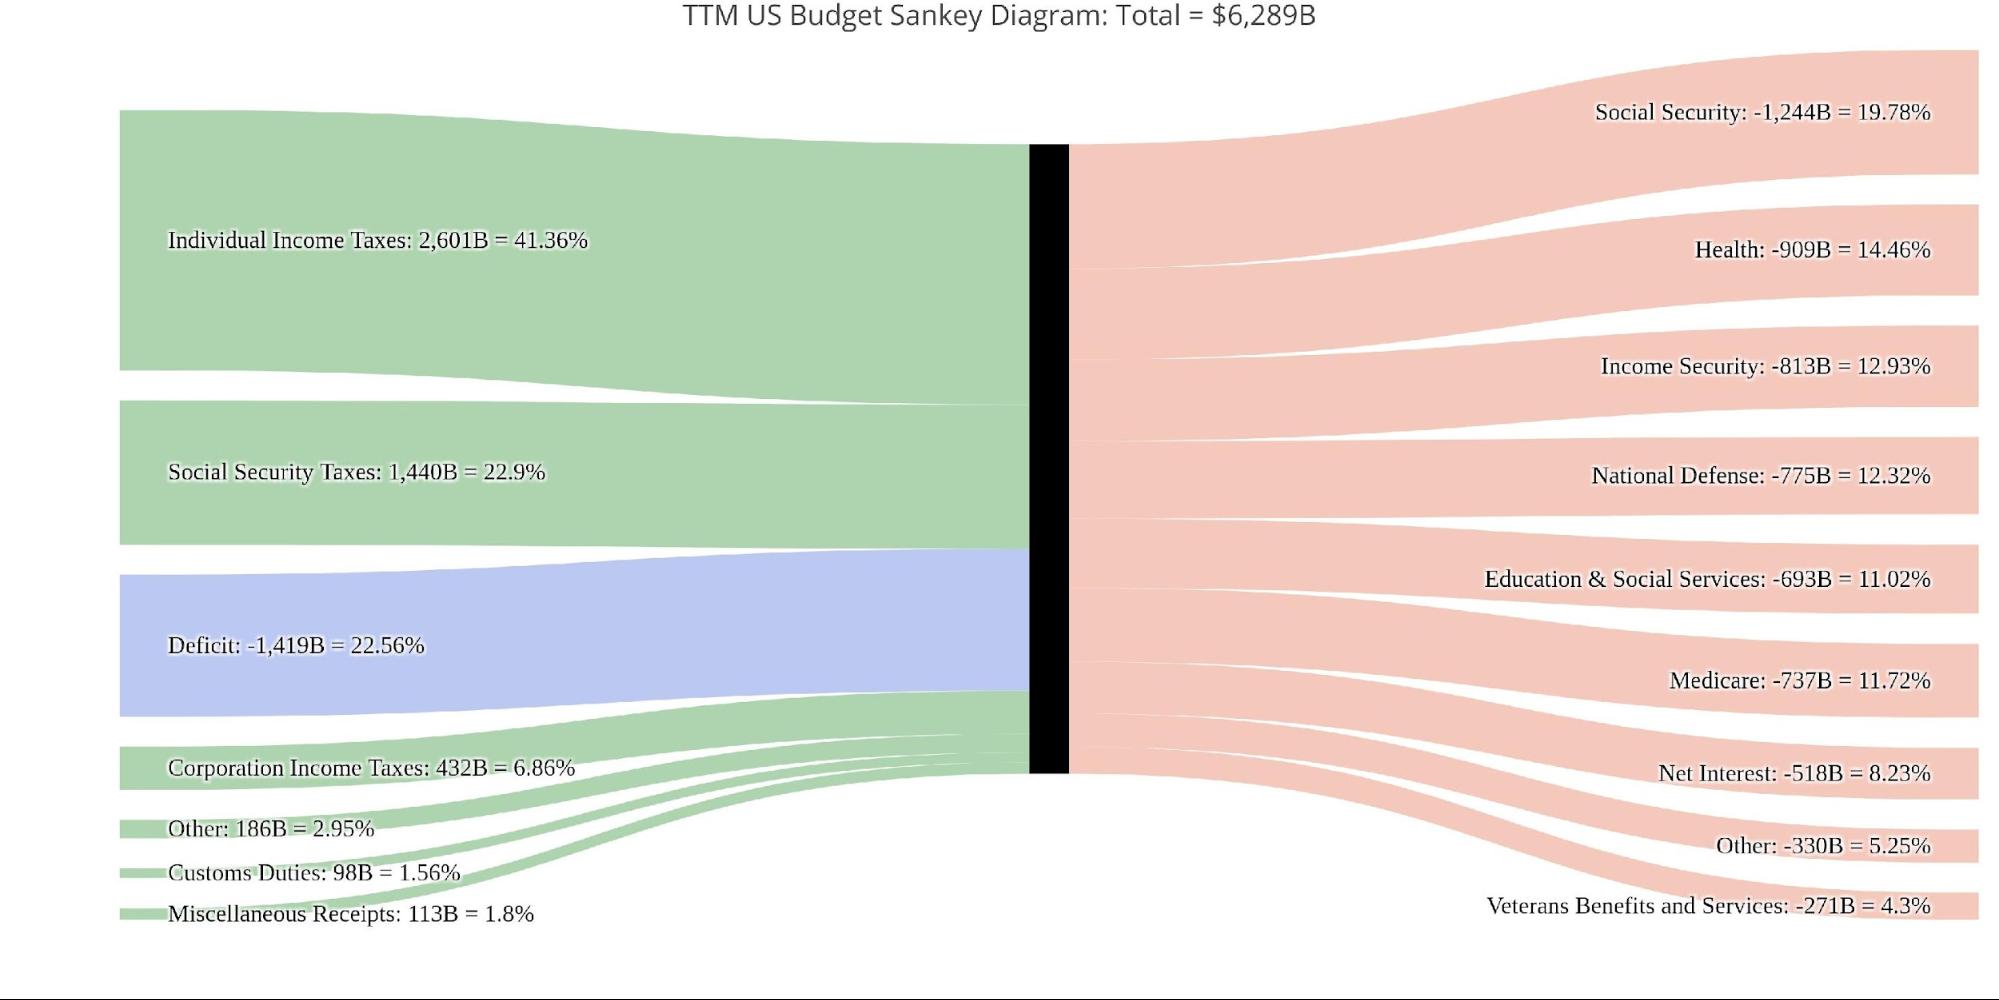
Looking at the TTM, the December Deficit was lower than the aggregate 12 months which represented 22.6% of total spending.
Figure: 5 TTM Federal Budget Sankey
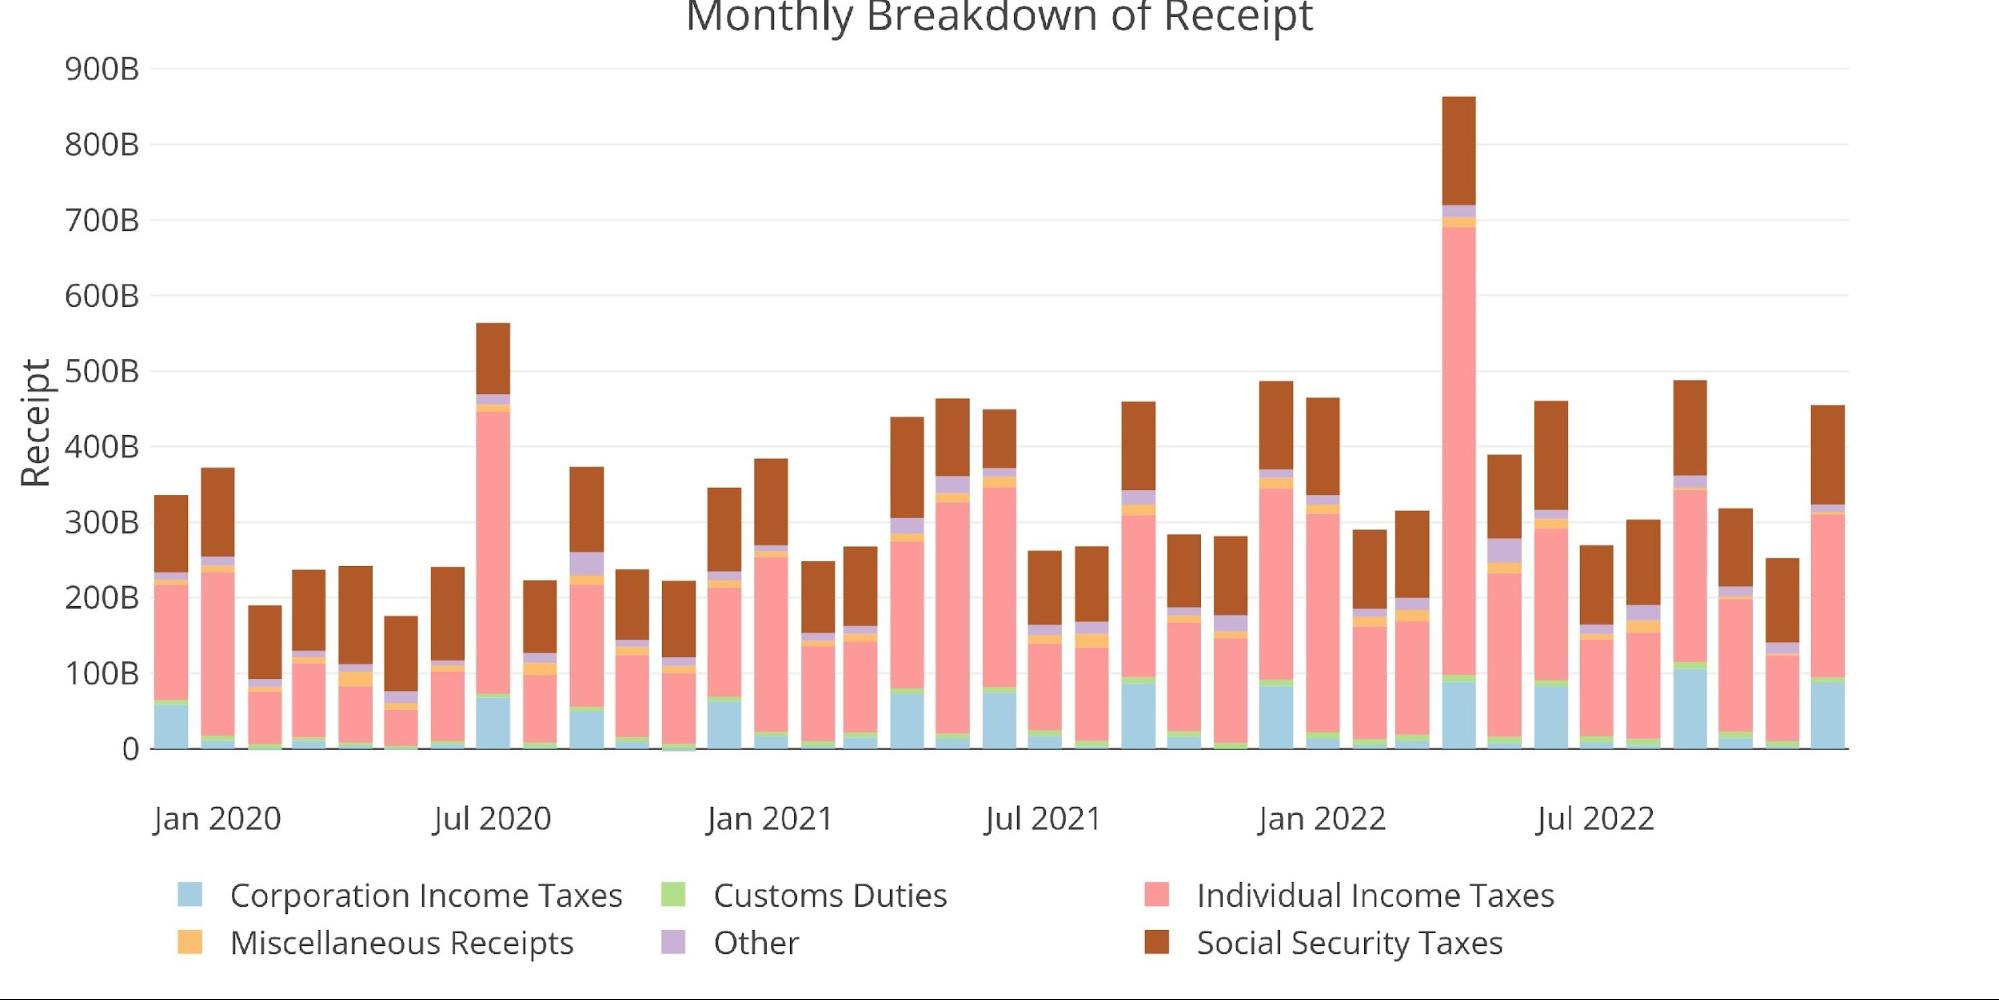
One thing that helped the Treasury this month was a surge in revenue from Corporate Taxes which occurs every 3 months or so.
Figure: 6 Monthly Receipts
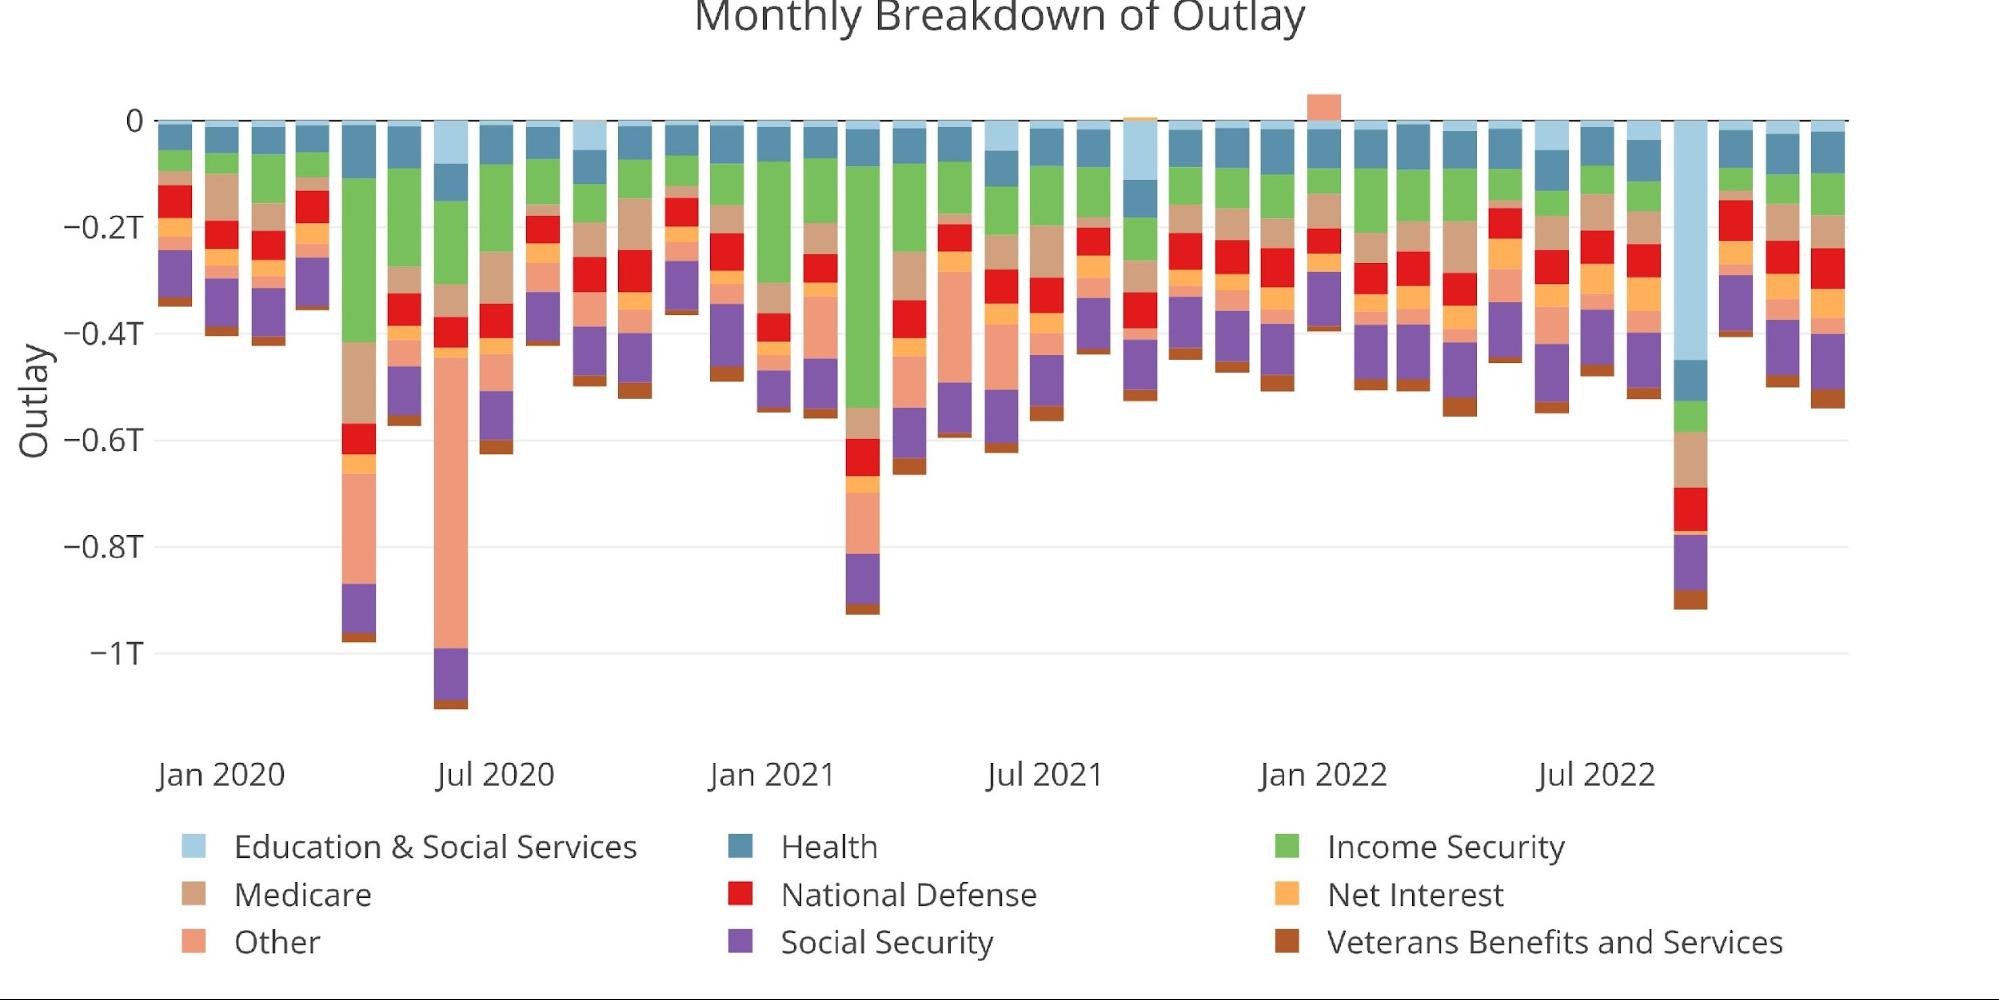
Total Expenses grew quite significantly this month, with all categories showing an expansion.
Figure: 7 Monthly Outlays
The elephant in the room remains the interest owed on the debt. On a TTM basis, this has surged to $517B which is $200B higher than it was in April of 2021. This is taxpayer money that is not buying anything or investing in anything of value. It is just money to finance the debt.


