

by Wolf Richter, Wolf Street:
![]() In several markets, prices plunged even faster than they’d spiked.
In several markets, prices plunged even faster than they’d spiked.
From the peak in May, house prices in the San Francisco Bay Area dropped by 11.6%, in the metros of Seattle by 11.3%, San Diego by 7.9%, Los Angeles by 6.0%, Denver by 5.7%; in the Dallas metro, prices dropped by 4.3% from the peak in June, according to the S&P CoreLogic Case-Shiller Home Price Index for “September,” released today, which consists of the three-month average of closed home sales that were entered into public records in July, August, and September, of deals that were made sometime around June through August – that’s the time frame we’re looking at here.
TRUTH LIVES on at https://sgtreport.tv/
This is the second month in this downturn that the index, which lags reality on the ground by 4-6 months, is showing month-to-month house price declines in all 20 metros in the index.
The biggest month-to-month drops occurred in:
- Seattle: -2.9%
- San Francisco: -2.9%
- Las Vegas: -2.4%
- Phoenix: -2.2%
- Dallas: -2.1%
- San Diego: -2.1
- Denver: -2.0%
Month-to-month drops of 2% or more in the Case-Shiller Index (a three-month moving average that smoothens month-to-month volatility) occurred only during Housing Bust 1 and in the current downturn.
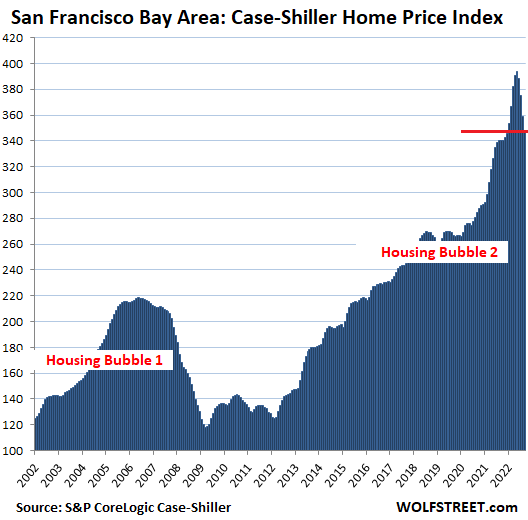
In the San Francisco Bay Area, house prices plunged 2.9% in “September” (three month moving average of July, August, and September) from August, and by 11.6% from the peak in May.
Plunging faster than spiking: Over those four months, the index plunged faster (-46 points) than it had spiked in the last four months of the huge spike (+40 points).
These four monthly drops in a row slashed the year-over-year gain to just 2.3%.
The Case Shiller Index for “San Francisco” covers five counties of the nine-county San Francisco Bay Area: San Francisco, part of Silicon Valley, part of the East Bay, and part of the North Bay.
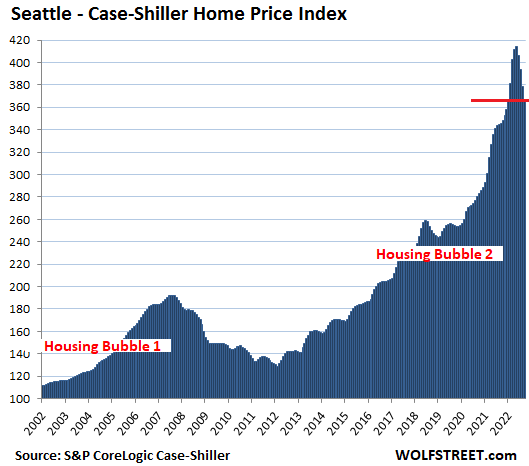
In the Seattle metro, house prices plunged 2.9% in September from August, and by 11.3% from the peak in May.
Over those four months, the index plunged nearly as fast (-47 points) than it had spiked during the last four months of the mind-blowing spike (+49 points).
These four months of drops slashed the year-over-year gain to 6.2%.
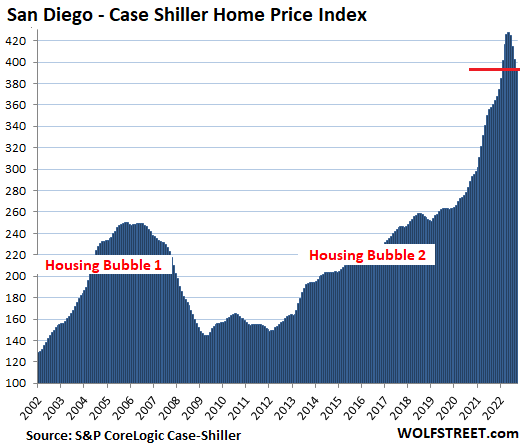
In the San Diego metro, house prices dropped 2.1% in September from August, and by 7.9% from the peak in May.
Down not as fast as up: -34 points in four months since peak, +44 points in last four months of the stunning spike.
These four months of drops cut the year-over-year gain to 9.5%.
Los Angeles metro:
- Month over month: -1.8%.
- From the peak in May: -6.0%.
- Year over year: +8.8%.
- -25 points in four months since peak compared to +38 points in last four months of spike.
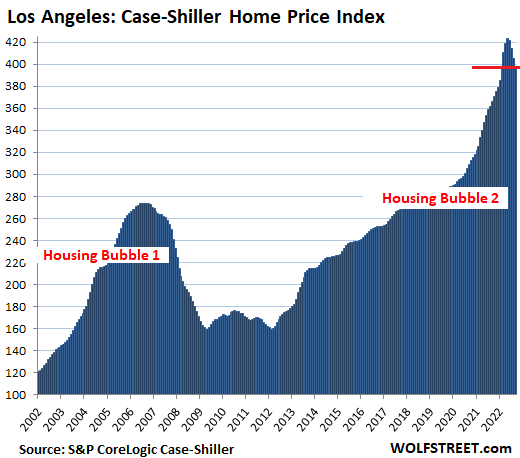
For Los Angeles, the current index value of 398 means that home prices shot up by 298% since January 2000, when the index was set at 100. Based on the increase since 2000, Los Angeles and then San Diego used to be the #1 Most Splendid Housing Bubbles in America. Both have now fallen below Miami (+304%), though prices in Miami have now started to drop as well.
The Case-Shiller Index uses the “sales pairs” method, comparing sales in the current month to when the same houses sold previously. The price changes within each sales pair are integrated into the index for the metro, are weighted based on how long ago the prior sale occurred, and adjustments are made for home improvements and other factors (methodology).