

by Alasdair Macleod, GoldMoney:

On the back of a further rise in the Fed Funds rate, the gold price made little progress this week. Silver outperformed. In European morning trade today, gold was at $1652, up $48from last Friday’s close. Silver was at $19.90, up 68 cents over the same timescale.
Our headline chart shows that silver has been outperforming gold since 1 September, when silver bottomed at $17.56. Since then, gold has continued to decline, down $50 from that time.
This puts the gold/silver ratio at an interesting juncture, as our next chart shows.
TRUTH LIVES on at https://sgtreport.tv/
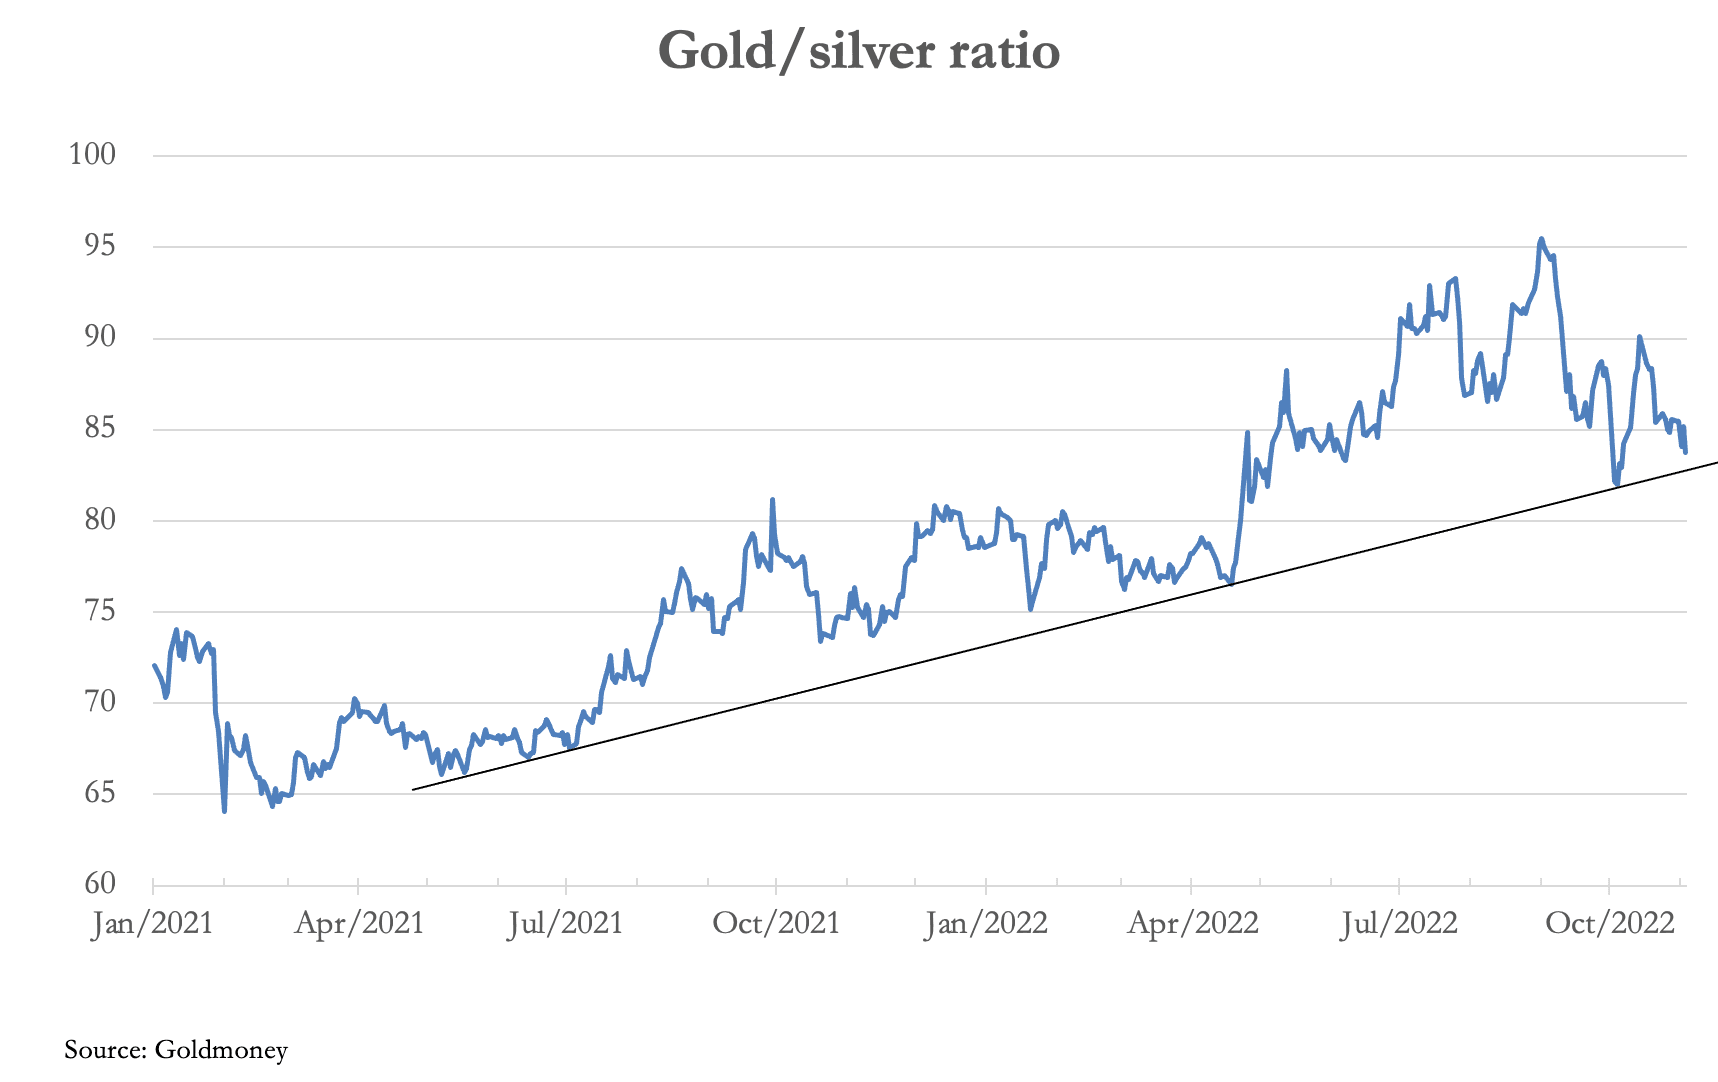
In technical terms, a break below 83 would violate the well-established uptrend of the last eighteen months and mark the point where traders would be confident of silver outperforming gold. This reading is confirmed by the severe lack of physical silver stocks available for market liquidity purposes.
Mainstream sentiment is generally positive for silver, but still negative for gold. A Reuters poll forecast an average gold price of $1,712.50 an ounce next year, hardly setting the world alight. Credit Suisse sees renewed pressure pushing it towards its core objective of $1,451. Deutsche Bank says that gold is in its worst slump since 1869!
It might be a touch cynical to suggest the more bullish view on silver reflects Comex swap dealers (mostly bullion bank trading desks) being long of silver contracts, while they are still short of Comex gold. Our next chart puts the gross and net gold position in context.

At the last Commitment of Traders release (25 October) gross shorts were valued at $26.7bn split between 19 traders (that’s an average of $1.41bn each), and net short of longs at $11.54bn. Swaps have made substantial progress in getting their exposure down since last March, but they are struggling to get it down much more.
We can see this reflected in the Managed Money position, which is already net short of 38,788 contracts. Gross MM shorts stand at 110,804, indicating how bearish this community of hedge funds has become. Our next chart illustrates the position at the last COT figures (update due tonight).

Since 25 October, the gold price has declined by about $50, and with the general bullishness for the dollar in paper markets and concomitant bearishness for gold, we can expect the hedge fund short position to be even more extreme for last Tuesday.
Away from the paper markets, we see genuine bullion demand being triggered at these levels. In China, domestic jewellery demand is reported to have jumped in the third quarter to 163 metric tonnes. But that is not all. Deliveries out of the Shanghai Gold Exchange’s vaults in the quarter totalled 647 tonnes, dwarfing jewellery demand.
Back on Comex, deliveries of gold contracts have been high so far this week, averaging nearly 1,000 a day. Clearly, attempts by the bullion banks to suppress prices, perhaps hoping to break the spirit of ETF holders, is creating physical demand.
