

by Peter Schiff, Schiff Gold:

Seasonally Adjusted Money Supply in October was negative for a third consecutive month, coming in at -$88B. This came on the heels of the largest drop in Money Supply ever last month.
Figure 2 below shows non-seasonally adjusted money supply which is a bit more erratic and is also one month ahead of seasonally adjusted. On a raw basis, there have been seven straight months of minimal or negative money supply growth.
TRUTH LIVES on at https://sgtreport.tv/
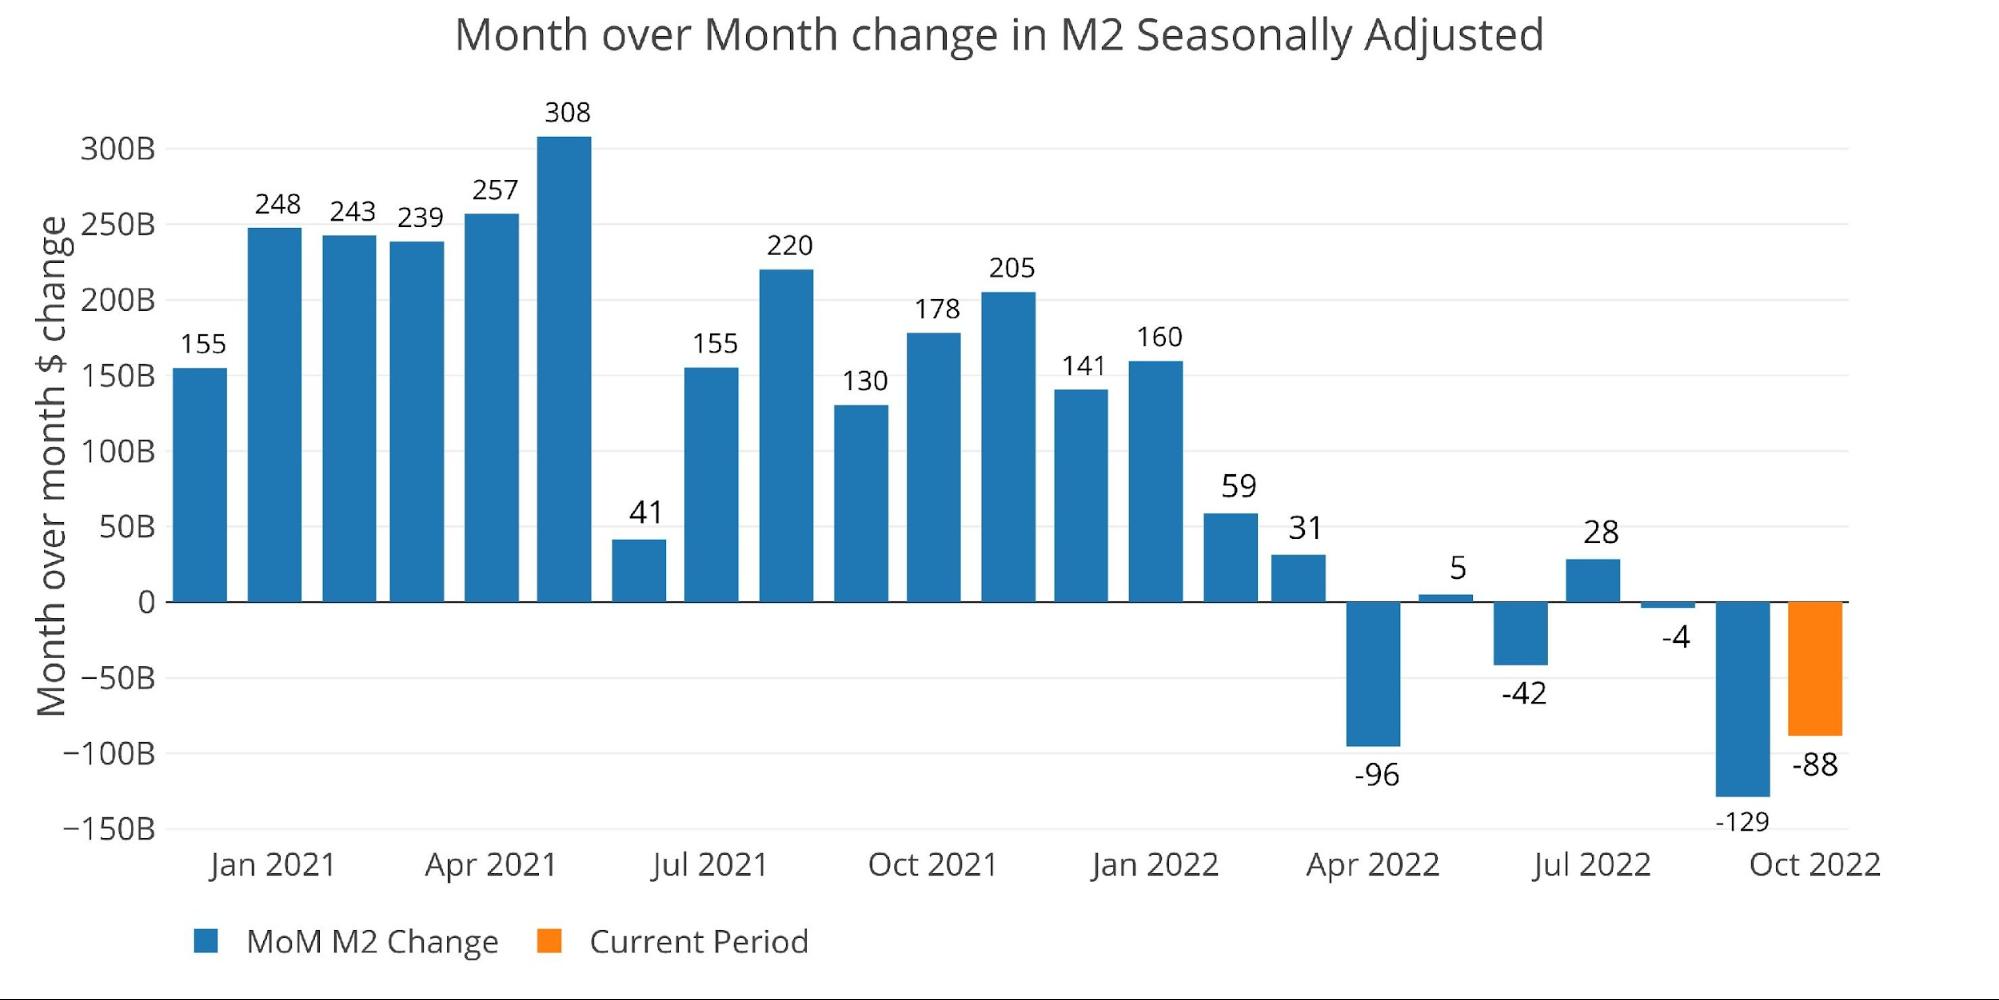

Figure: 2 MoM M2 Change (Non-Seasonally Adjusted)
Looking at seasonally adjusted, the latest month is well below the 6-month average growth rate (-4.8% vs -2.1%). This is way below the 1-year growth rate of 1.3% and well below the three-year annualized growth rate of 12.2%.
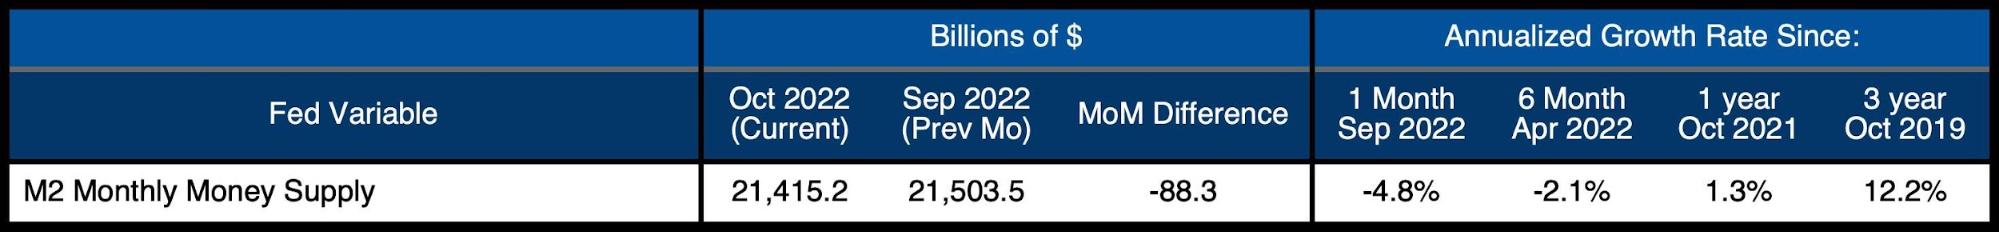
Figure: 3 M2 Growth Rates
When looking at the average monthly growth rate, before Covid, October historically expands at an annualized rate of 6.7%. This year missed by an incredible 1,150 bps.
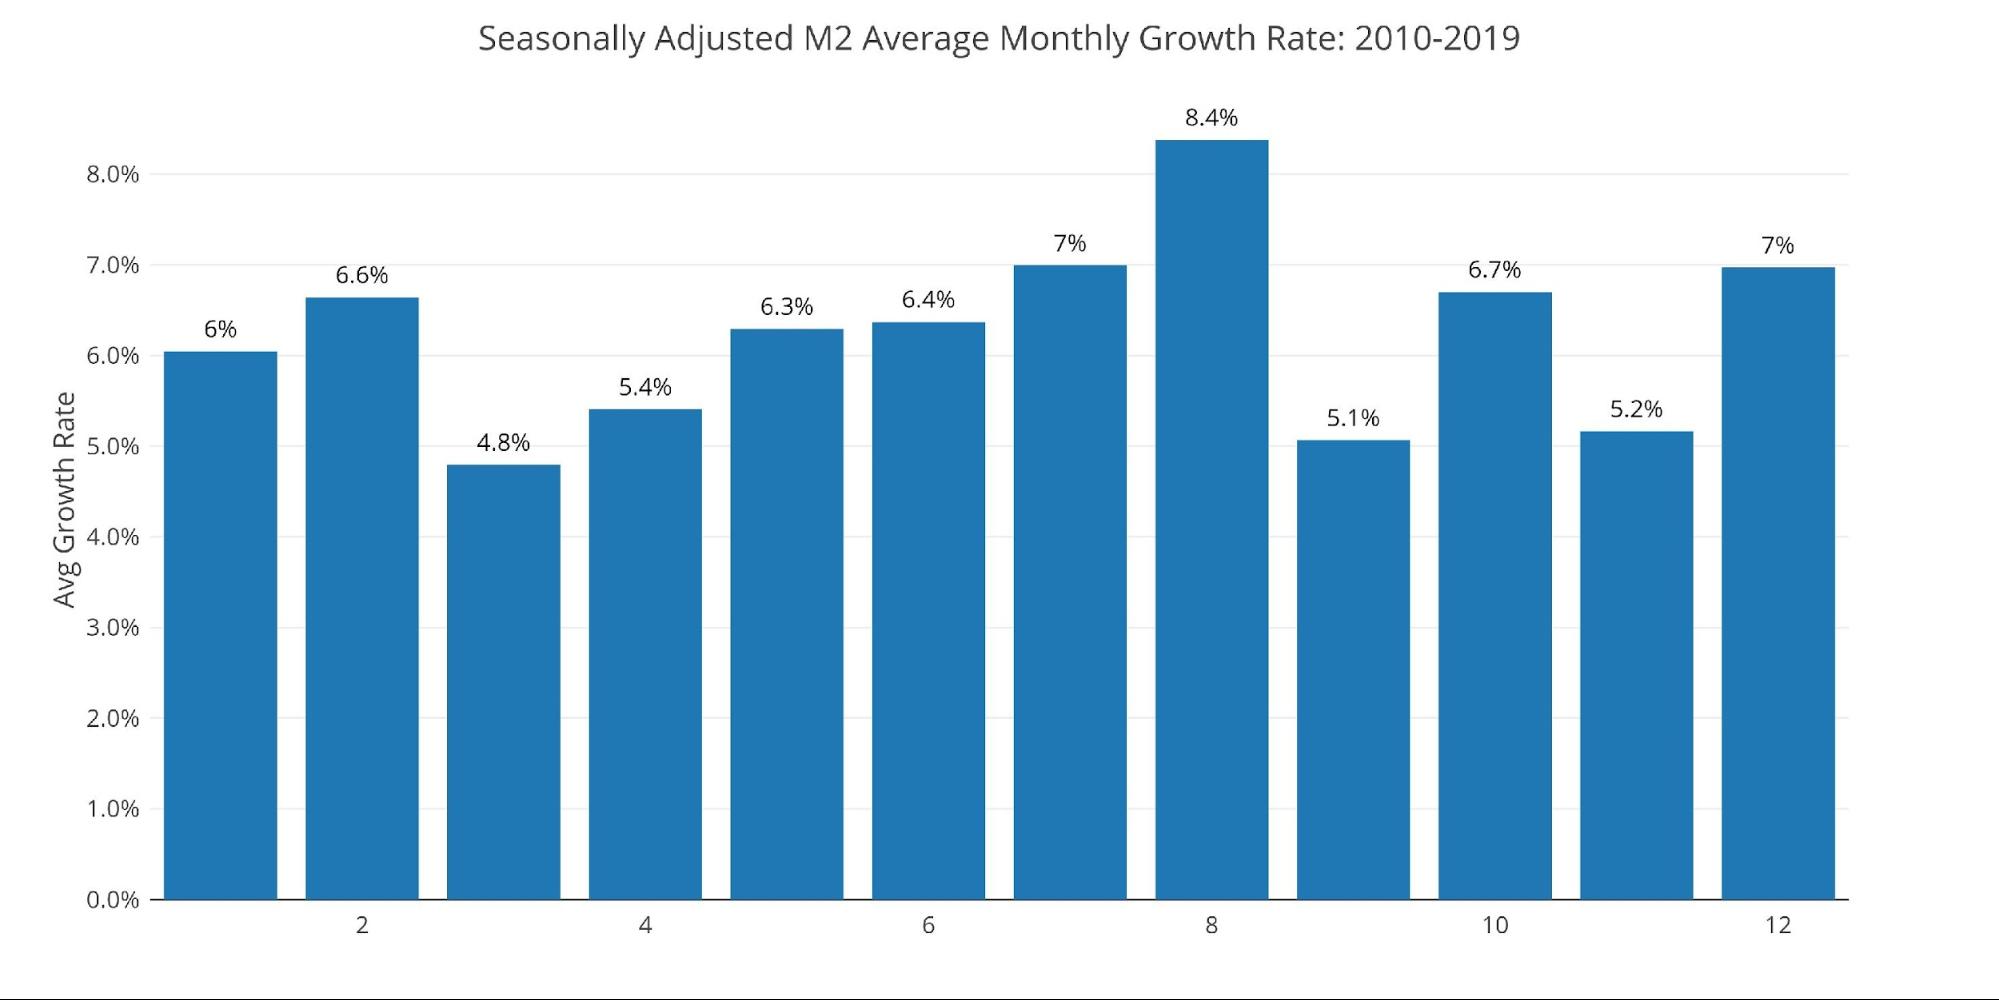
Figure: 4 Average Monthly Growth Rates
The Fed only offers weekly data that is not seasonally adjusted. As the chart below shows, the recent period has seen much smaller gains in the positive weeks and much more frequent negative months.
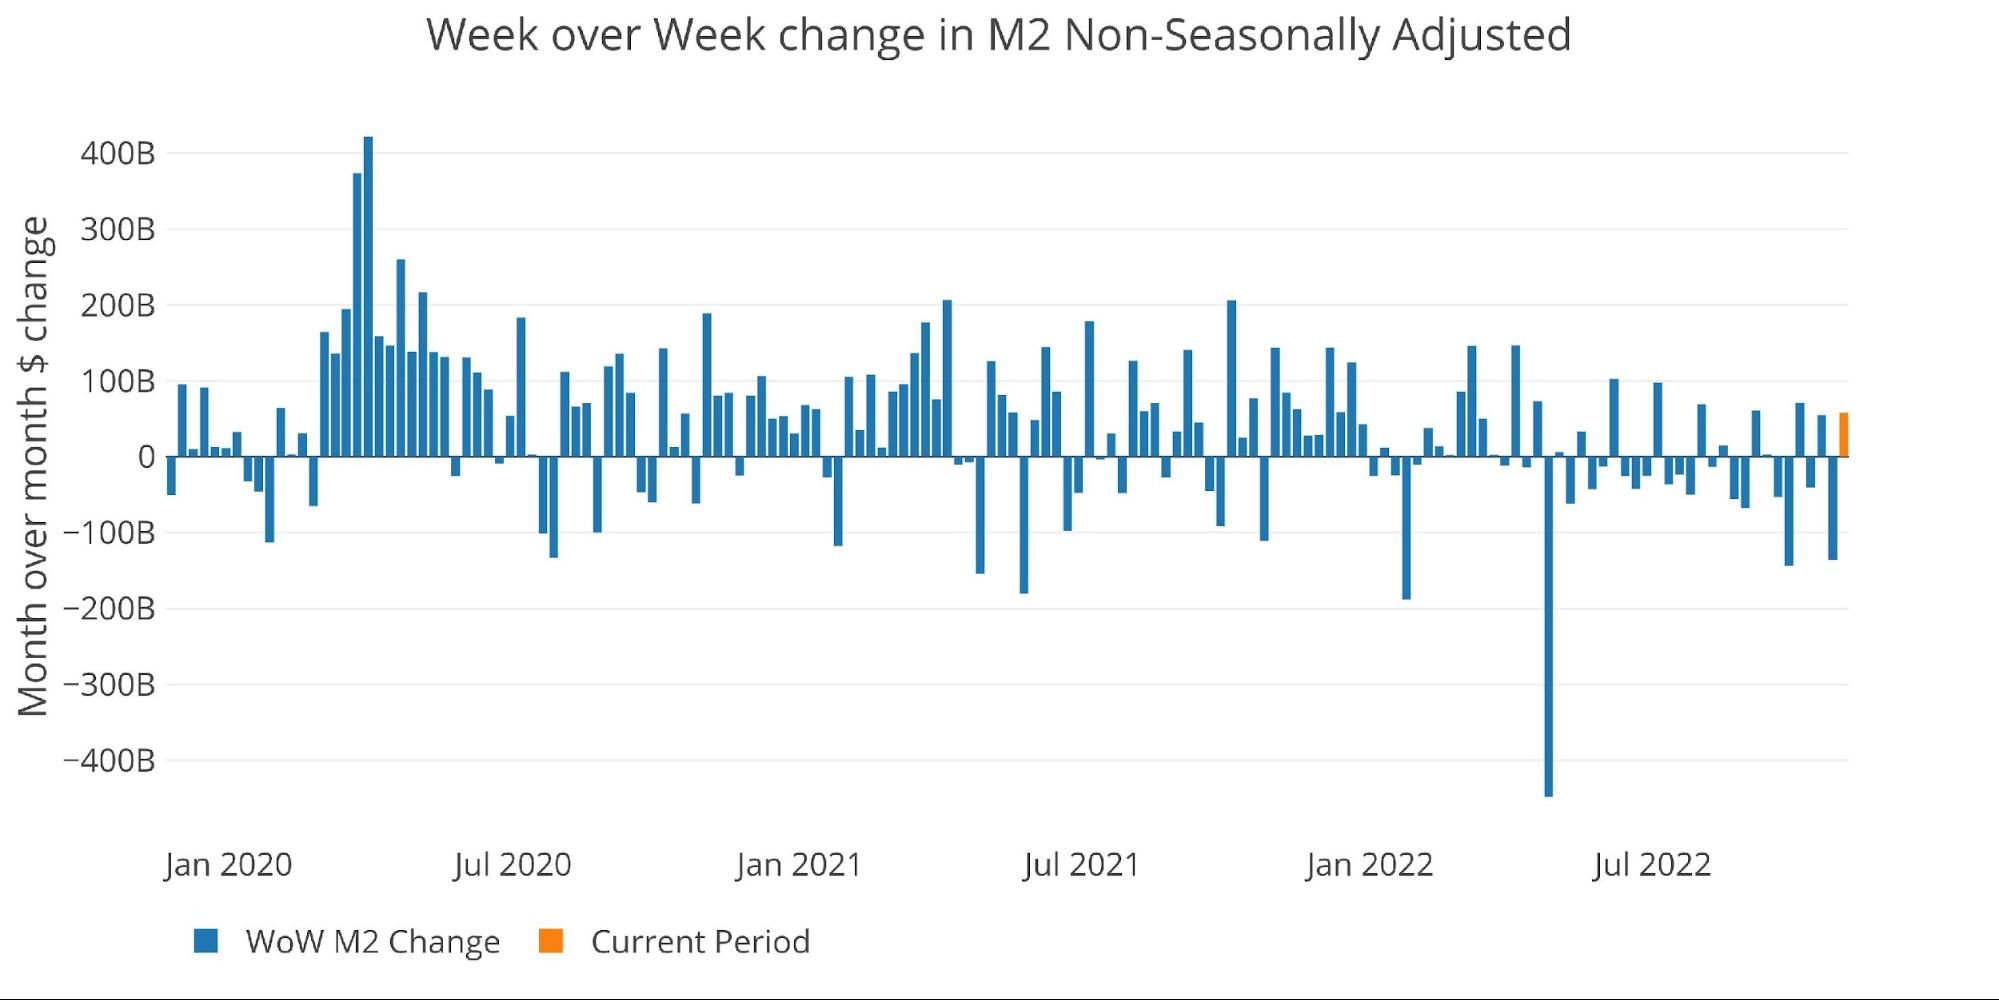
Figure: 5 WoW M2 Change
The “Wenzel” 13-week Money Supply
The late Robert Wenzel of Economic Policy Journal used a modified calculation to track Money Supply. He used a trailing 13-week average growth rate annualized as defined in his book The Fed Flunks. He specifically used the weekly data that was not seasonally adjusted. His analogy was that in order to know what to wear outside, he wants to know the current weather, not temperatures that have been averaged throughout the year.
The objective of the 13-week average is to smooth some of the choppy data without bringing in too much history that could blind someone from seeing what’s in front of them. The 13-week average growth rate can be seen in the table below. Decelerating trends are in red and accelerating trends in green.
")
