by Peter Schiff, Schiff Gold:

The Fed has found it easier to raise rates than shrink its balance sheet. September was supposed to be the month when the Fed got serious about shrinking the balance sheet. After a few months of warming up with $47.5B monthly reductions, the Fed was going to step up in September and shrink by $95B ($60B in Treasuries and $35B in MBS).
TRUTH LIVES on at https://sgtreport.tv/
That didn’t happen.
Breaking Down the Balance Sheet
In the prior four months, the Fed only hit the $45B target a single time – last month. It should be no surprise then that September fell woefully short of the target, seeing only a $31B reduction. Even this meager run-off has created chaos in the Treasury market with the yield curve seeing pronounced volatility in recent weeks. Given the environment, how long until the Fed follows in the BoE footsteps and re-enters the market, using “crisis mode” as the excuse? Given the mathematical impossibility the Treasury faces in the months ahead, it won’t be too long!
Figure: 1 Monthly Change by Instrument
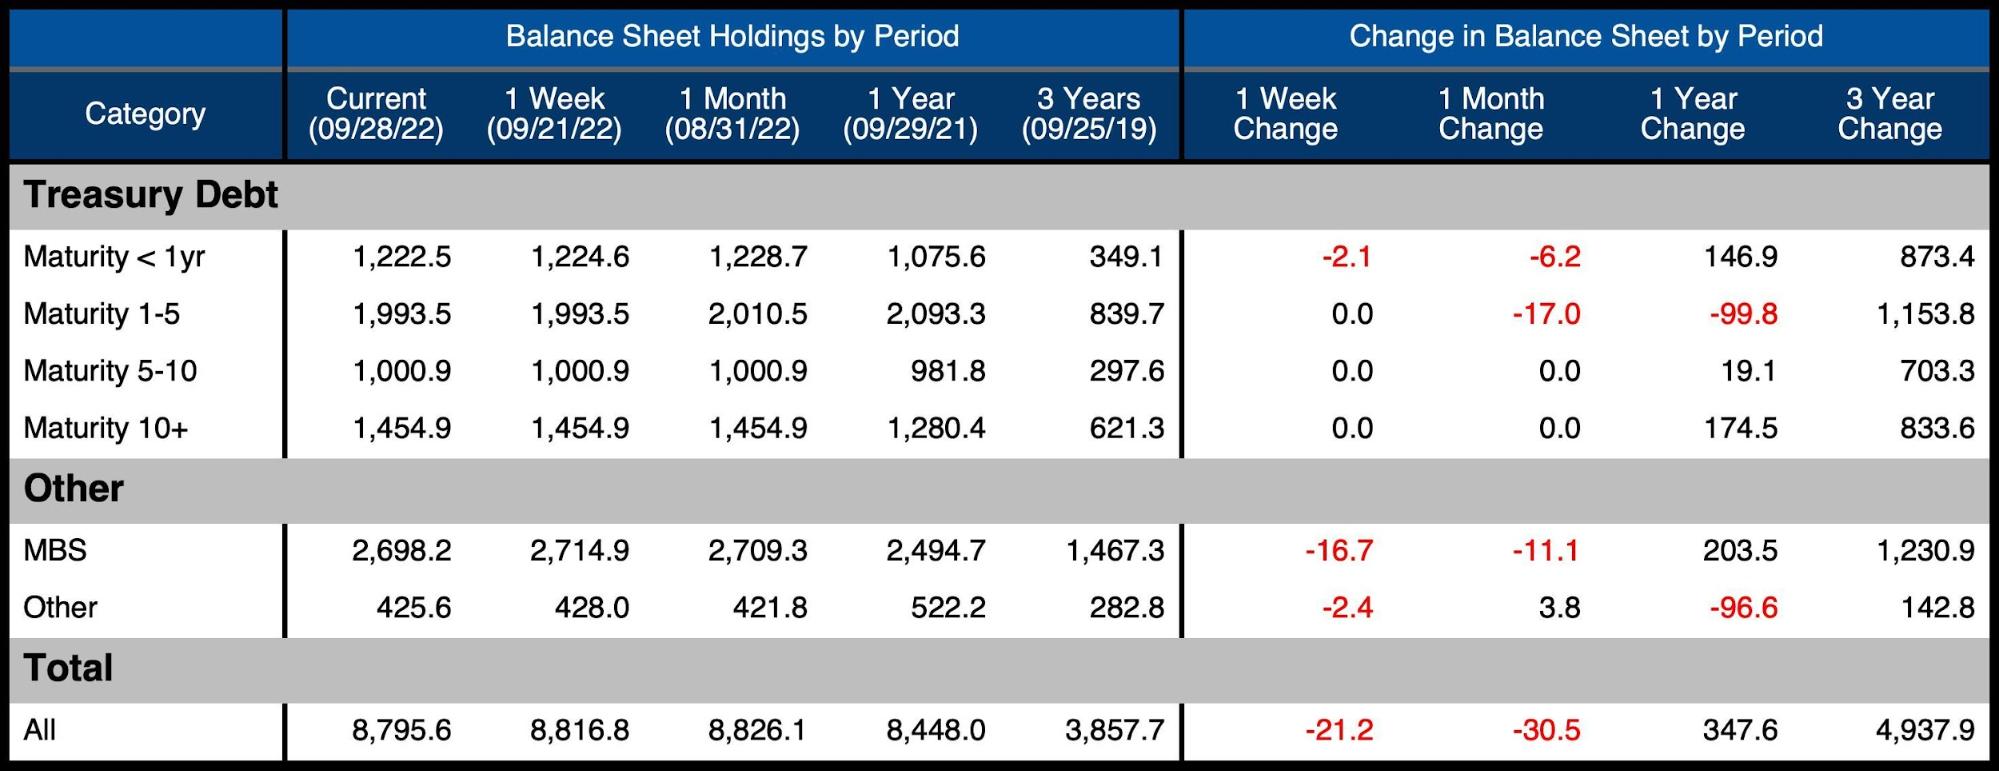
The table below details the movement for the month:
-
- The Treasury market only saw reductions in securities maturing in less than 5 years
-
- Only $23.2B rolled off, which represents 38.7% of the target
-
- MBS was even worse with $11.1B rolling off which represents 31% of the target
- The Treasury market only saw reductions in securities maturing in less than 5 years
Figure: 2 Balance Sheet Breakdown
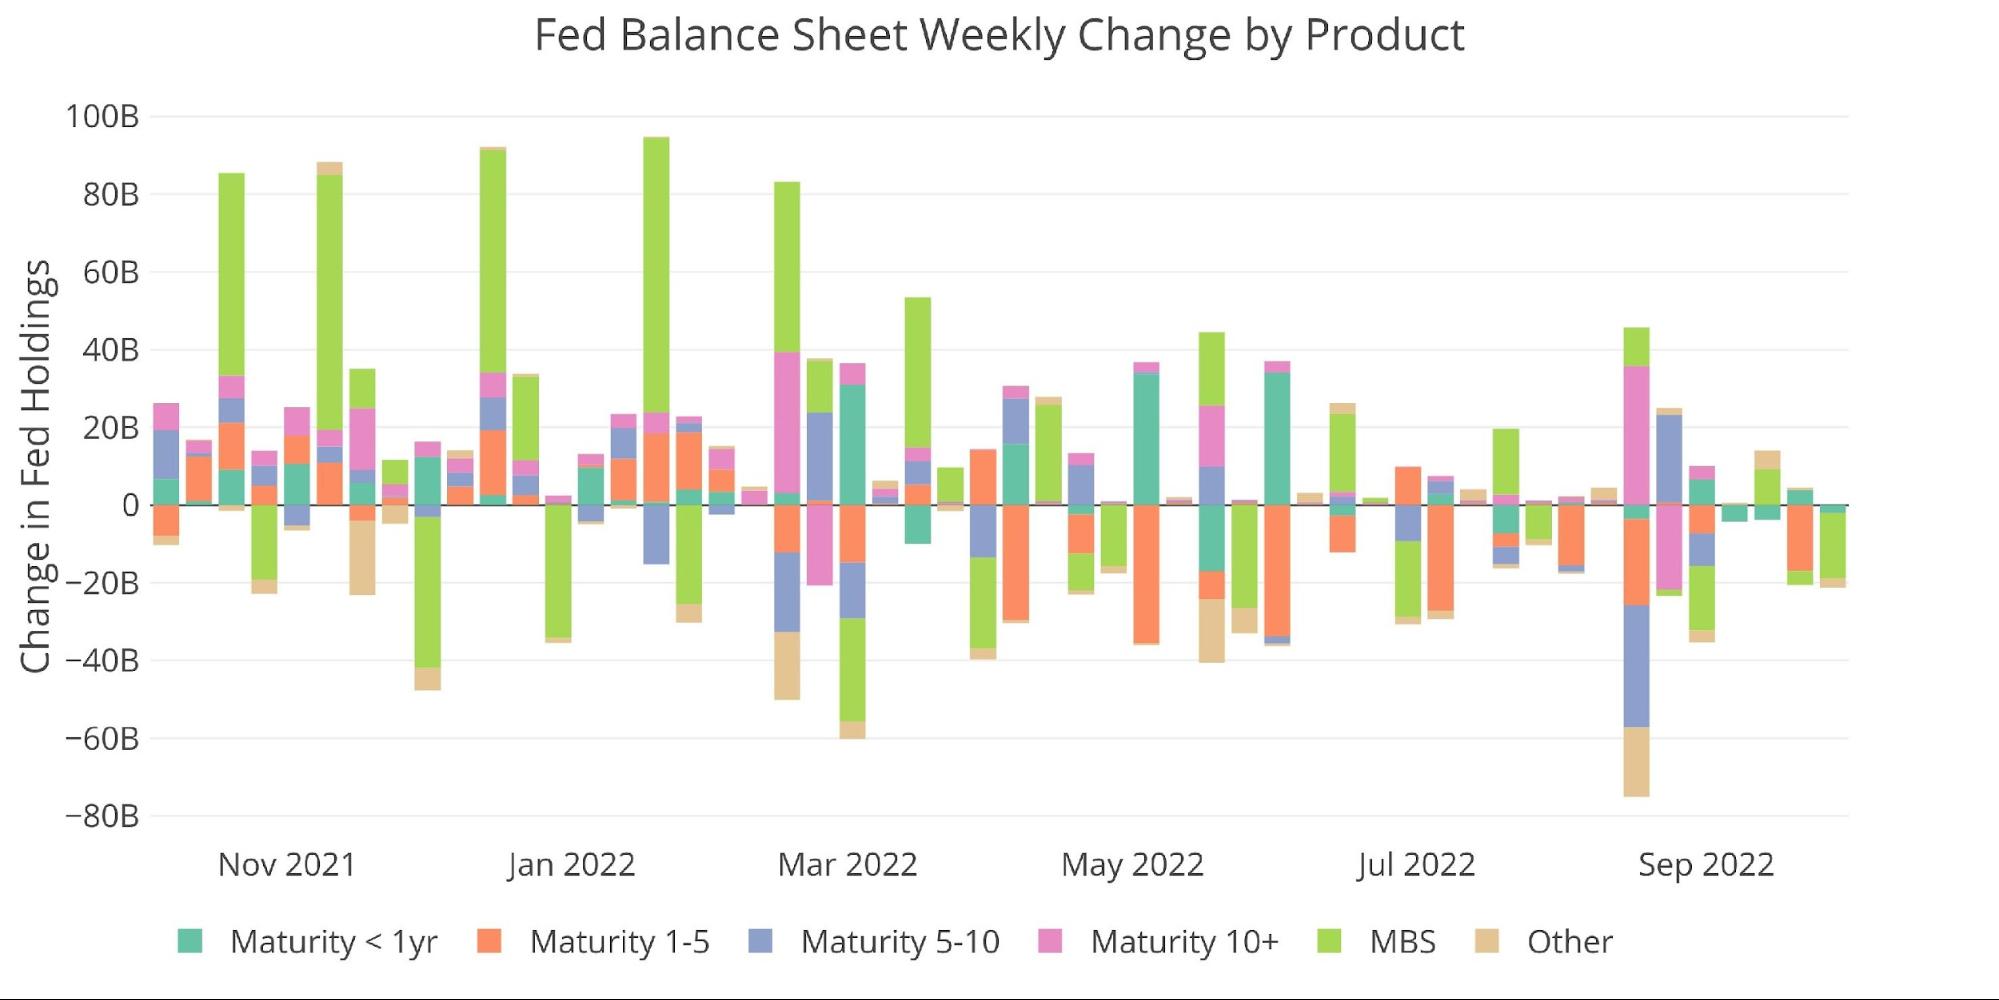
Looking at the weekly data shows that the first two weeks of September (third and fourth from the right) were extremely muted. It wasn’t until the last two weeks that the balance sheet saw any meaningful reduction.
Figure: 3 Fed Balance Sheet Weekly Changes
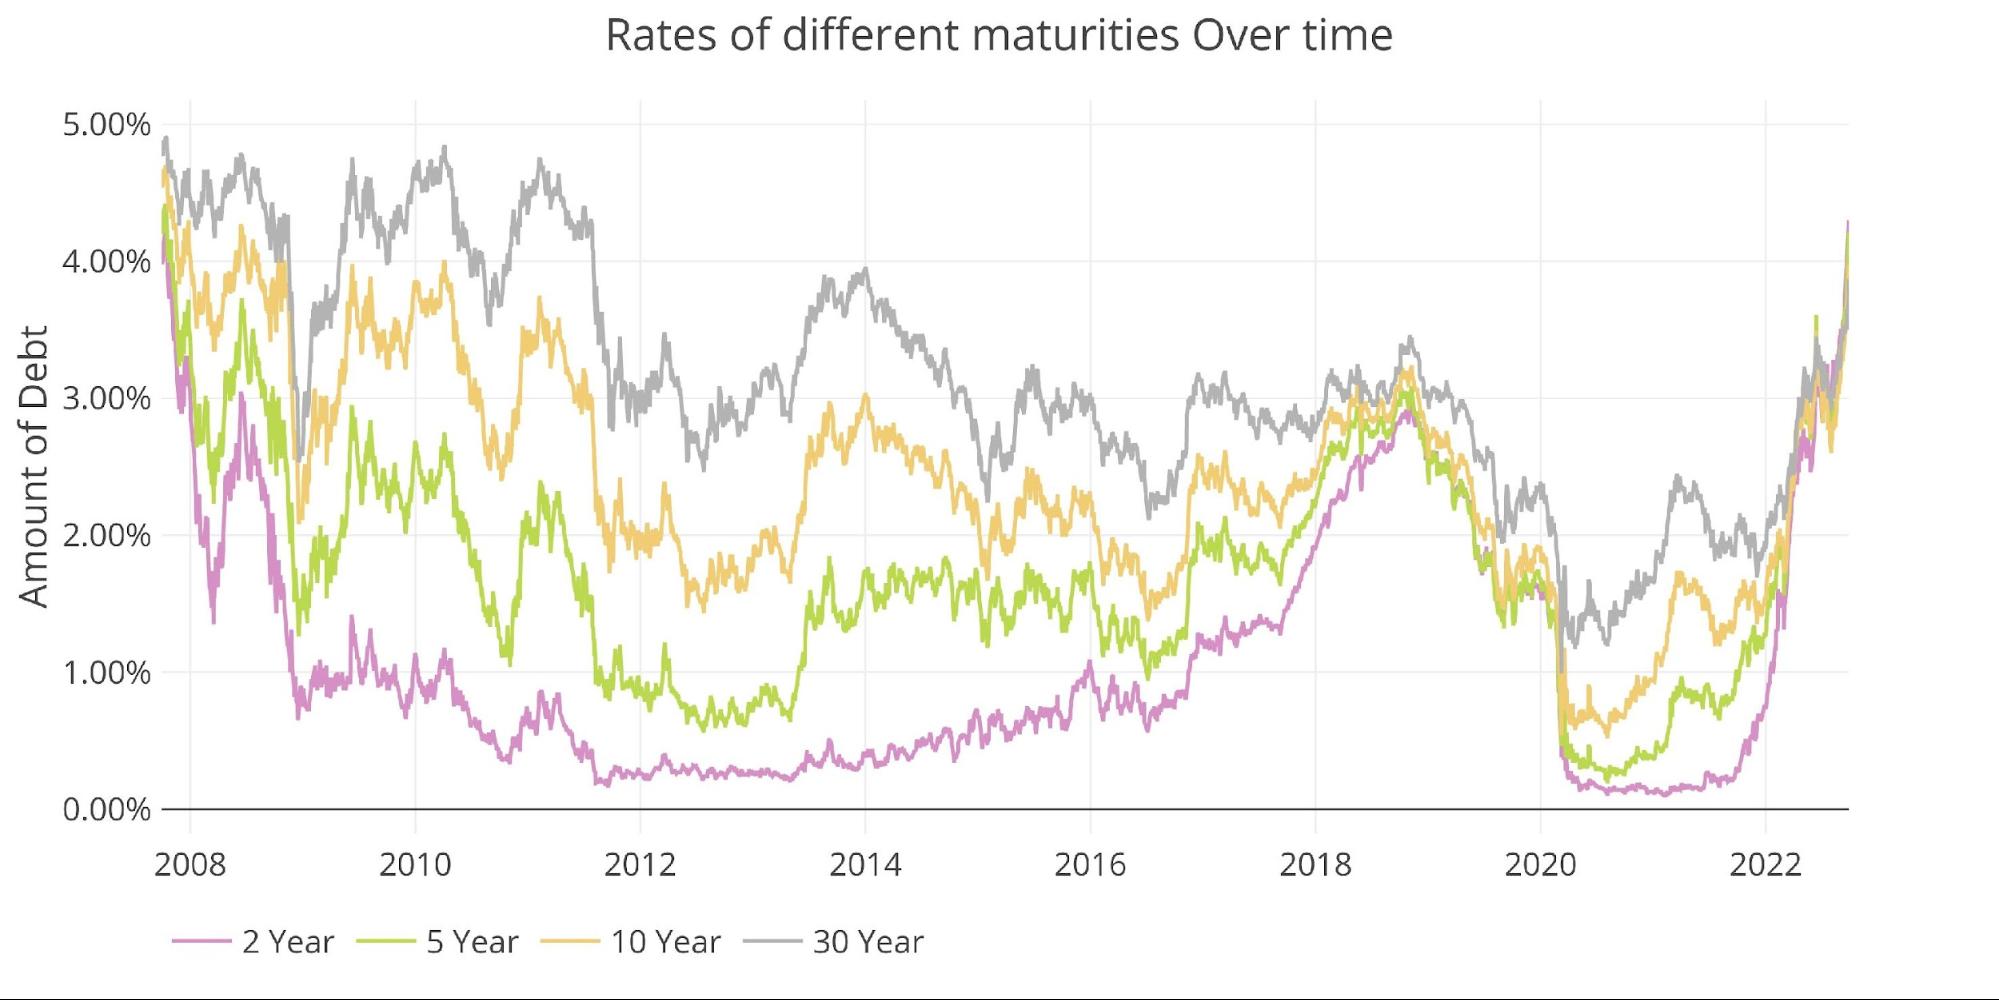
The bond market is mostly responding to the rate hikes, but the Fed’s attempt at QT will only exacerbate the carnage shown below. Things have really accelerated in the last few weeks as shown by the massive spike in yields below. This is an unprecedented move in a typically safe-haven market. And to reiterate, this is with the Fed avoiding the QT it promised to markets!
Figure: 4 Interest Rates Across Maturities
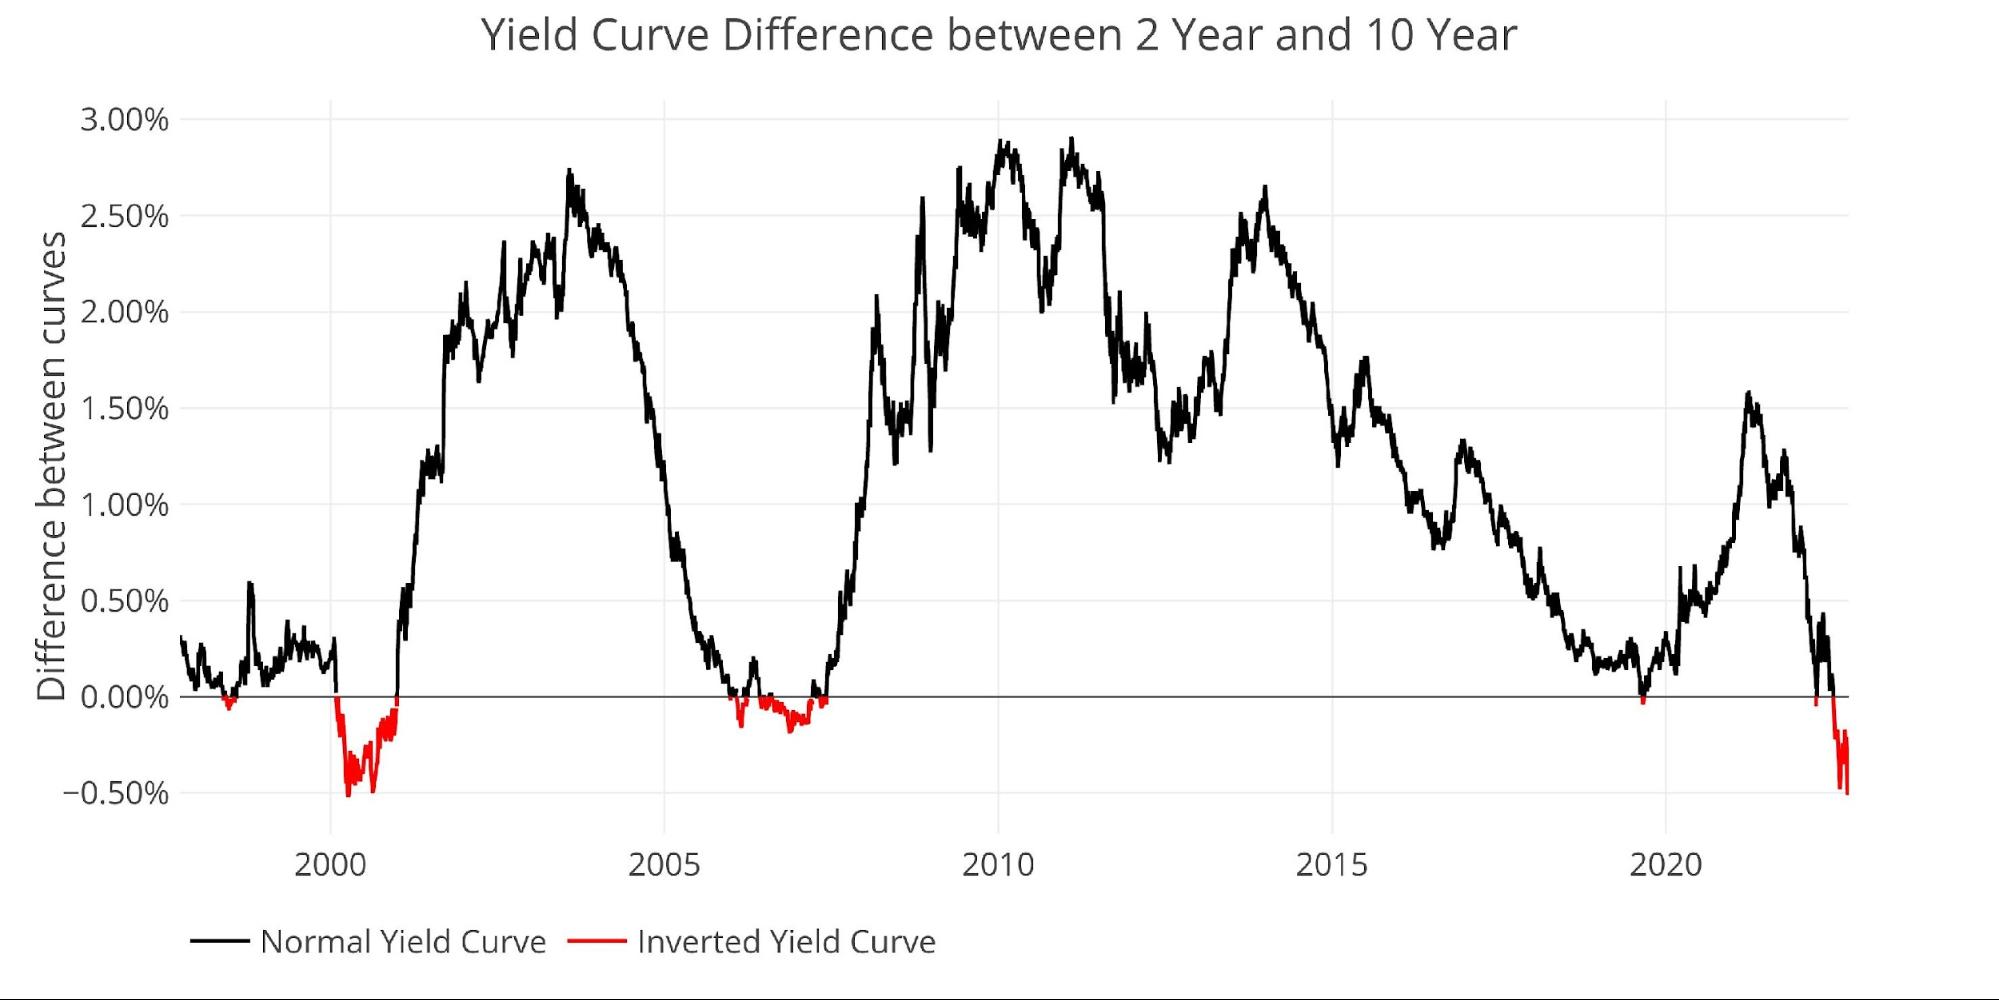
This is showing up in the yield curve spread between the 10-year and 2-year. The curve has been strongly inverted since July 4th.
Figure: 5 Tracking Yield Curve Inversion
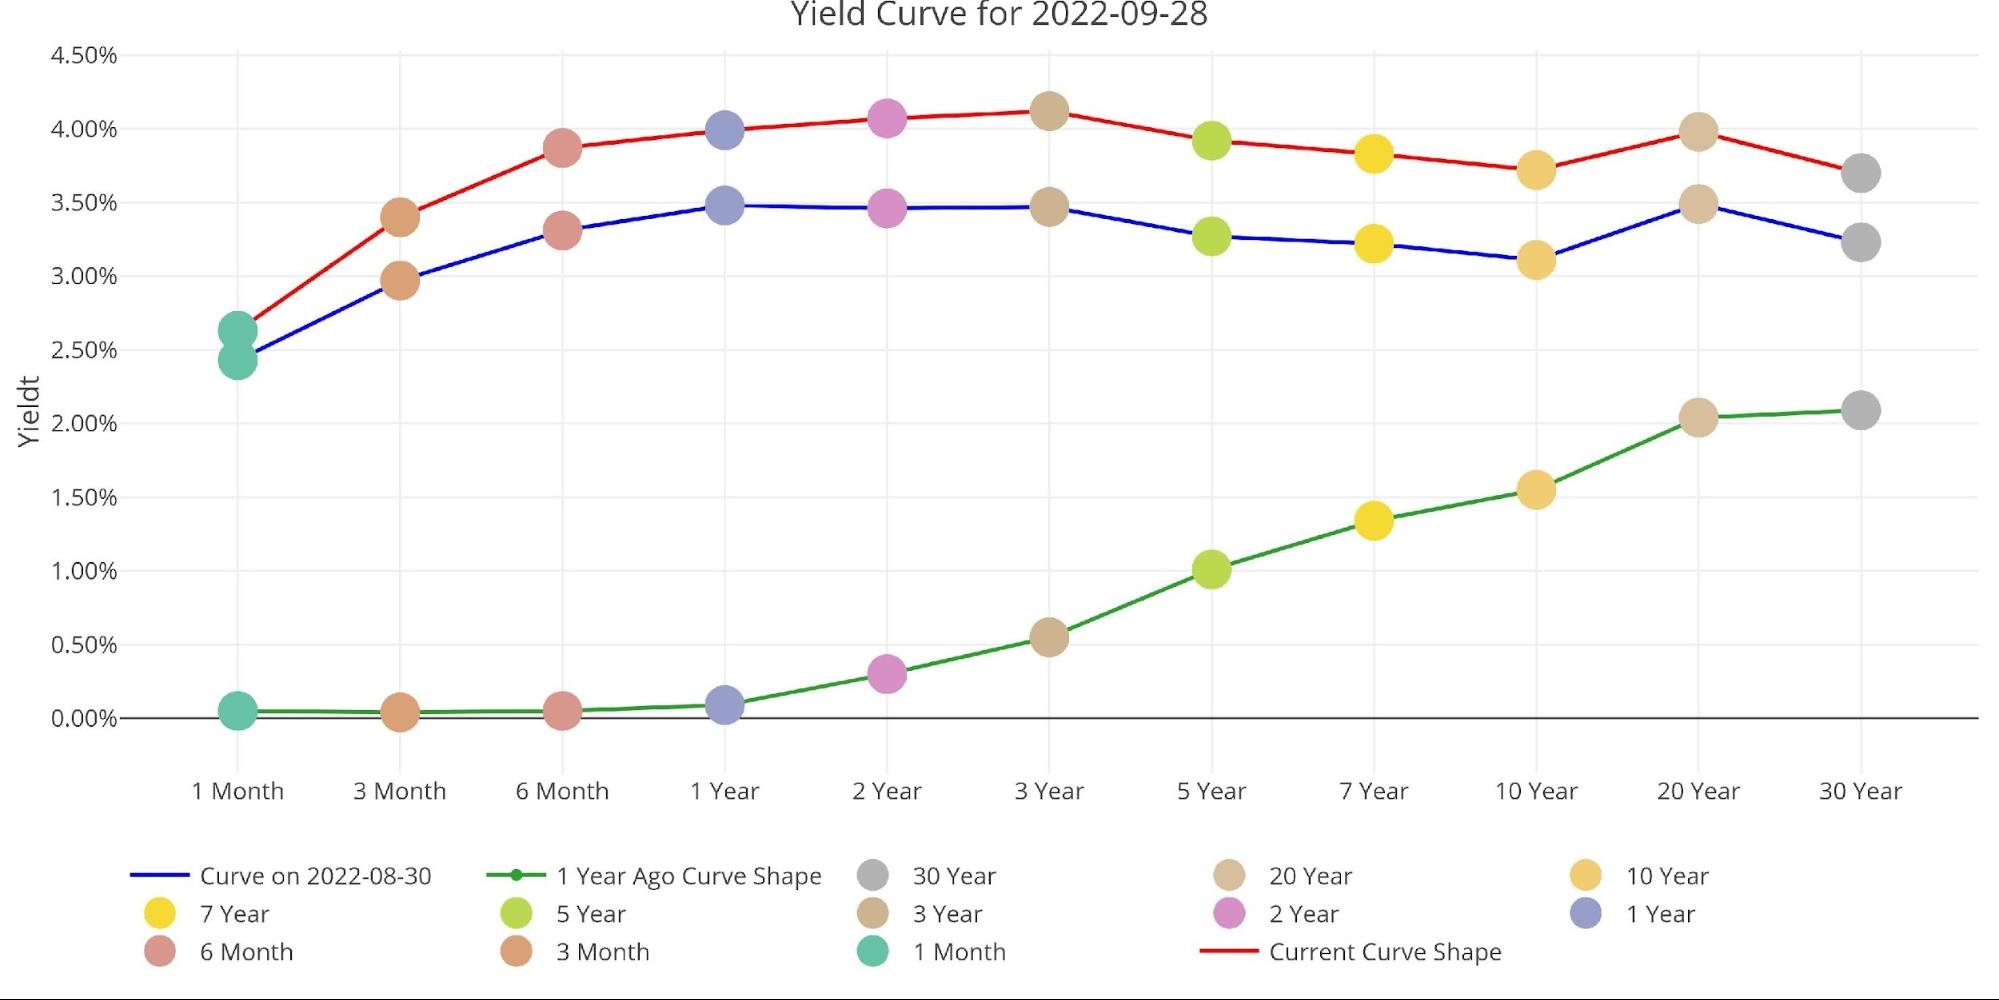
Looking at the entire yield curve shows how much has changed over the last month and year. The entire curve has shifted up in the last month by about 55bps and is well above and flatter than the at the same point last year. Several maturities are popping above 4%!
Figure: 6 Tracking Yield Curve Inversion
Who Will Fill the Gap?
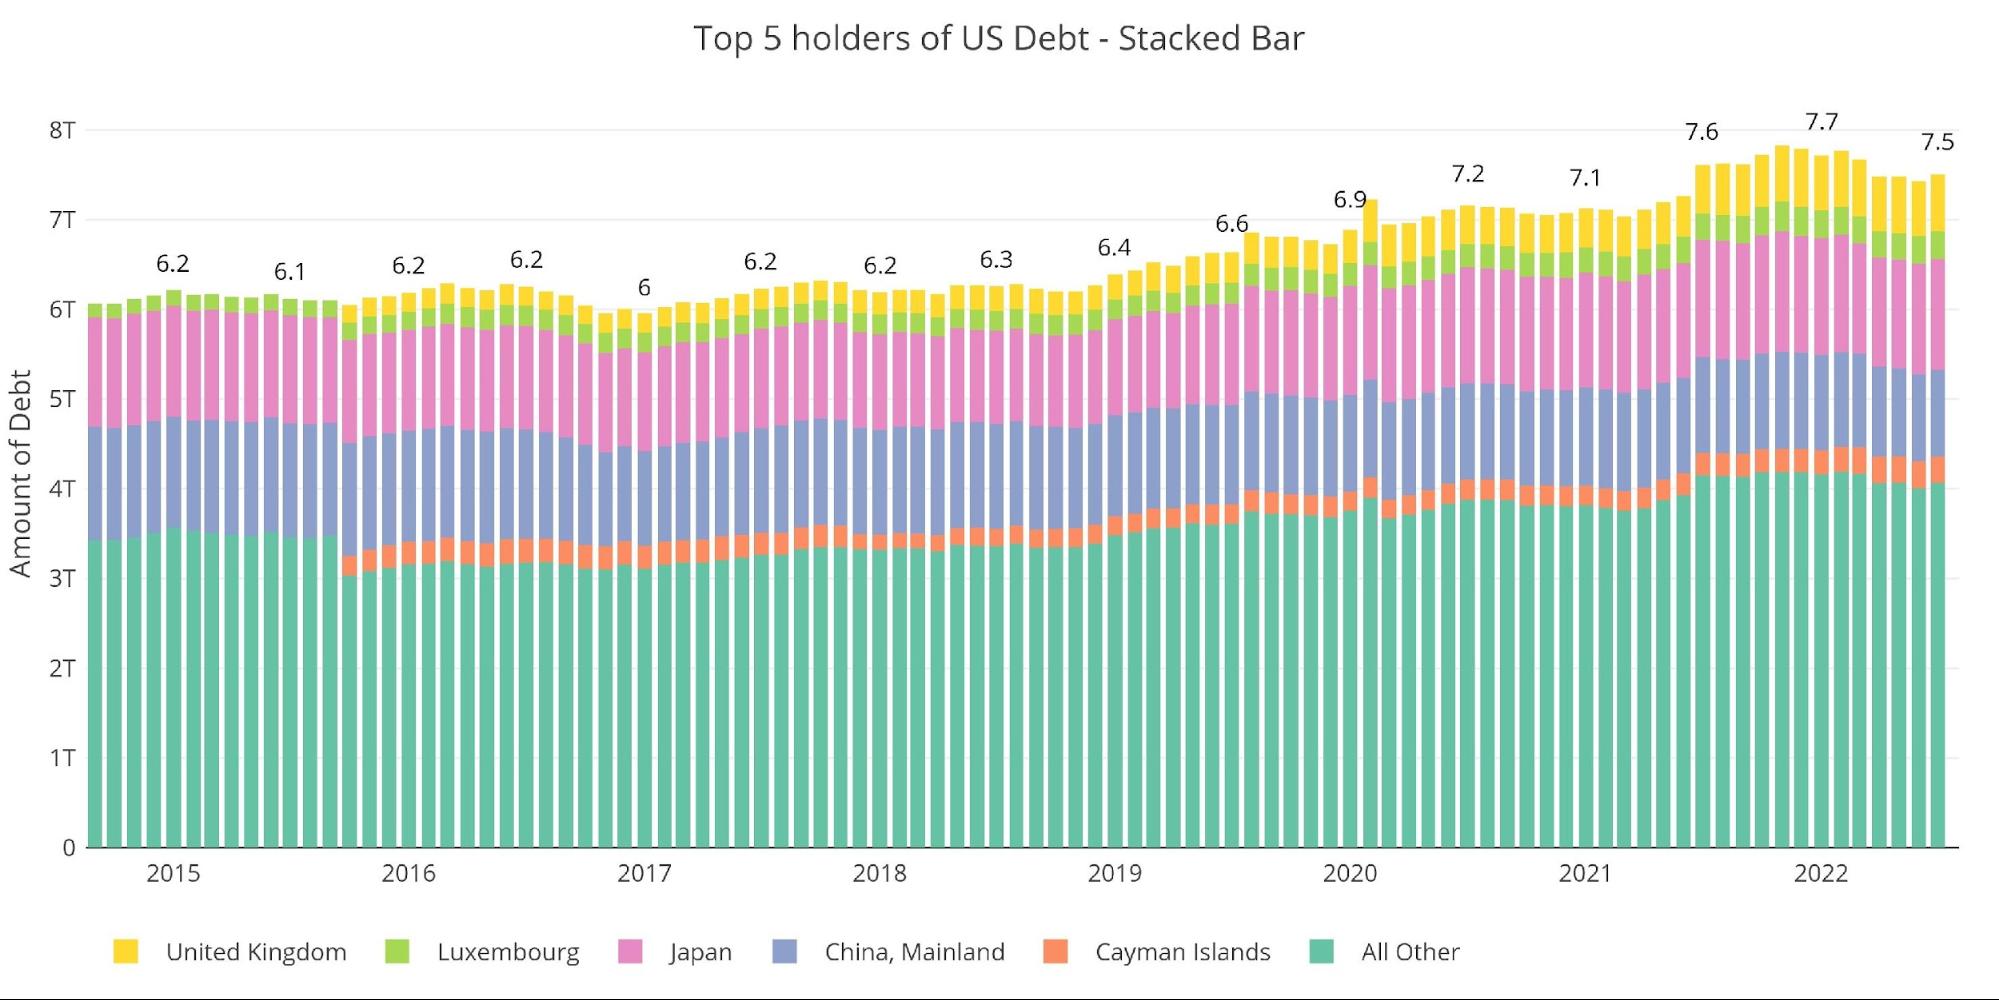
As the Fed leaves the market and enters as a seller, someone will need to step in and purchase the debt the Fed has been buying. The chart below looks at international holders of Treasury securities. International holdings continue to fall, though there was a slight uptick in the most recent month.
China is still less than $1T and Japan actually saw a very minor reduction MoM.
Note: Data was last published as of July
Figure: 7 International Holders
The table below shows how debt holding has changed since 2015 across different borrowers. The net change over the last year is a reduction of $100B. The YoY reduction from both China and Japan can be seen clearly below.


