

by Wolf Richter, Wolf Street:
![]() The Case-Shiller index, which lags by several months, is starting to flip market by market, including in Phoenix, Dallas, Washington DC, and Boston.
The Case-Shiller index, which lags by several months, is starting to flip market by market, including in Phoenix, Dallas, Washington DC, and Boston.
By Wolf Richter for WOLF STREET.
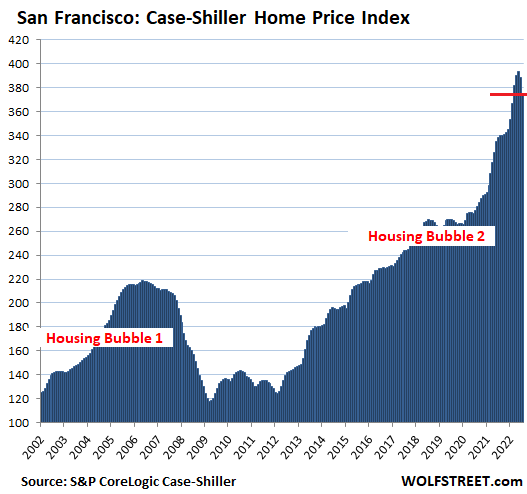
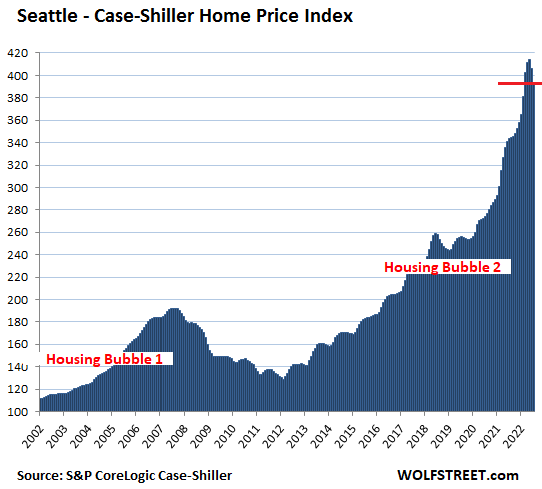
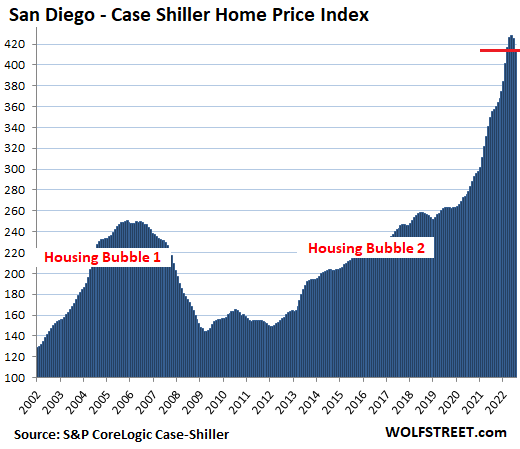
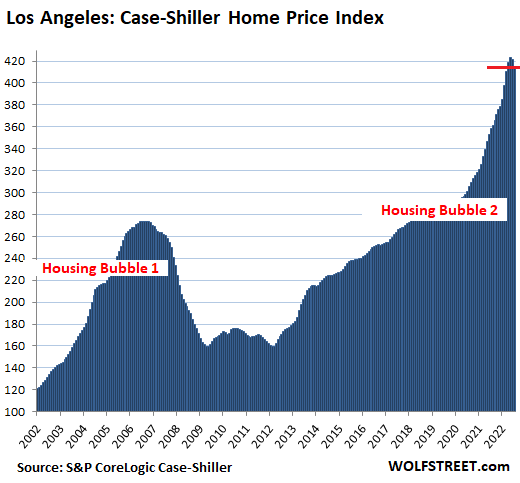
A month ago, the S&P CoreLogic Case-Shiller Home Price Index, which lags housing market reality on the ground by 4-6 months, started picking up the first month-to-month price declines, all of them in the West: the metros of Seattle, San Francisco, San Diego, Los Angeles, Denver, and Portland.
TRUTH LIVES on at https://sgtreport.tv/
Those price declines have now sharply steepened, according to today’s Case-Shiller Home Price Index, and price declines are now spreading across the US, including Boston, Phoenix, Dallas, and Washington DC. And what a huge shocker, even in San Diego, the #1 Most Splendid Housing Bubble in America, prices dropped by 2.5%, the metro’s largest month-to-month drop since Housing Bust 1.
That the housing market is seriously weakening in sales and prices across the US has been apparent in other data that is more immediate but easily skewed by changes in the mix of what was sold. The housing market in California is among the trail blazers, with dismal sales volume and sharply dropping prices. In the big Bay Area counties, including San Francisco, the median prices are down below where they’d been a year ago, and even in Southern California they’re seriously sagging.
Today’s release of the Case-Shiller Index was for “July,” which consists of the three-month average of closed home sales that were entered into public records in May, June, and July. Due to the delay between when a deal is made to sell a house and when the “closed sale” is entered into public records, the time span today for “July” roughly covers deals made in April through June. During that time, the average 30-year fixed mortgage rate was in the 5% to 6% range.
The Most Splendid Housing Bubbles where prices fell.
In the San Francisco Bay Area, house prices plunged by 3.5% in “July” (three month moving average of May, June, and July) from June, the steepest month-to-month drop since February 2012, at the bottom of Housing Bust 1, after having dropped 1.3% in June.
These two drops came after the ridiculous spike over the past two years, and brought the year-over-year gain down to 10.8%, from 16% in the prior month and from over 24% earlier this year. A couple more drops like this, and the index will catch up with the median price and be negative year-over-year.
For the Case Shiller Index, the metro consists of the five-counties covering San Francisco, part of Silicon Valley, part of the East Bay, and part of the North Bay.
In the Seattle metro, house prices plunged by 3.1% in “July” from June, the biggest month-to-month plunge since January 2009, during the depth of Housing Bust 1. This followed the 1.9% drop in the prior month. Both drops combined wiped out the prior four months of gains, thereby going down on the other side of a totally ridiculous spike. This slashed the year-over-year gain down to 8.4%, from 27% earlier this year.
In the San Diego metro, house prices fell by 2.5% in “July,” the biggest month-to-month drop since January 2012, and the second month-to-month decline in a row, after a most splendidly ridiculous spike. The index is now below the March level. This slashed the year-over-year gain to 16.6%.
The index value of 414 for San Diego means that home prices shot up by 314% since January 2000, when the index was set at 100 (over the same period, the Consumer Price Index rose by 75%). The index for San Diego has now dropped to the same level as Los Angeles (414), and both share the honor of being the #1 Most Splendid Housing Bubble in America.
In the Los Angeles metro, house prices fell by 1.6% in July from June, the sharpest decline since March 2012, and the second month in a row of declines. This whittled the year-over-year price gain down to +15.7%.
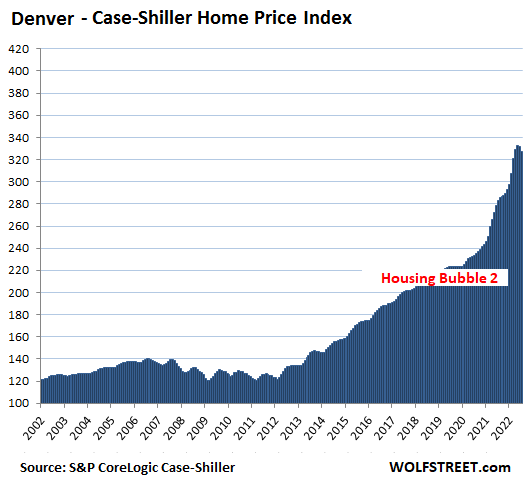
In the Denver metro, house prices dropped 1.4% in July from June, the second month in a row of declines, whittling down the year-over-year gain to 15.6%:
In the Portland metro, house prices dropped 1.1% in July from June, the second month in a row of declines, after a ridiculous spike. This whittled down the year-over-year gain to 11.7%:
